

Introduction
Quoted from MSDN : “Counters are used to provide information as to how well the operating system or an application, service, or driver is performing. The counter data can help determine system bottlenecks and fine-tune system and application performance. The operating system, network, and devices provide counter data that an application can consume to provide users with a graphical view of how well the system is performing.”
I couldn’t have said it better.
Our little project today will help you work with Performance Counters. Obviously there are many many more performance counters available on your system than what I’ll cover here, as this is only a quick and dirty introduction to performance counters.
Design
Design your VB.NET or C# Form as follows:
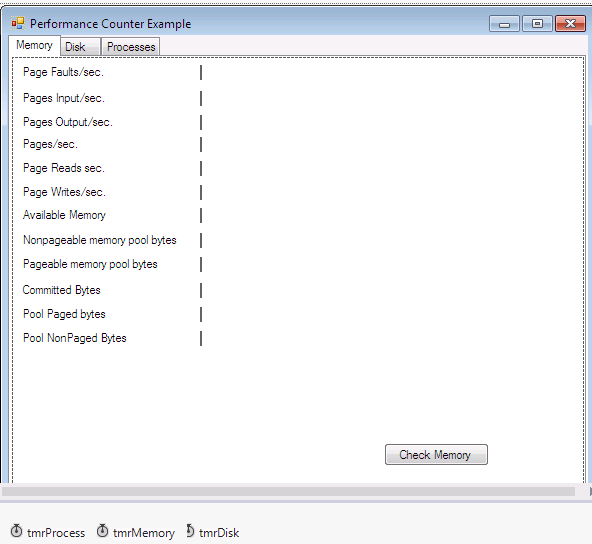
Figure 1 – Memory Counters
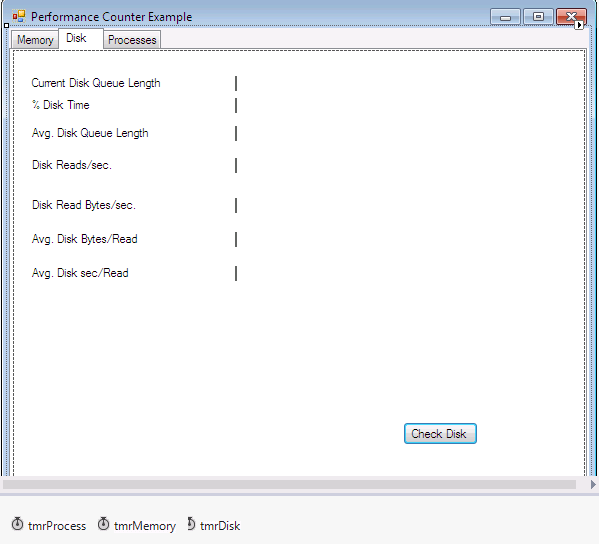
Figure 2 – Disk Counters
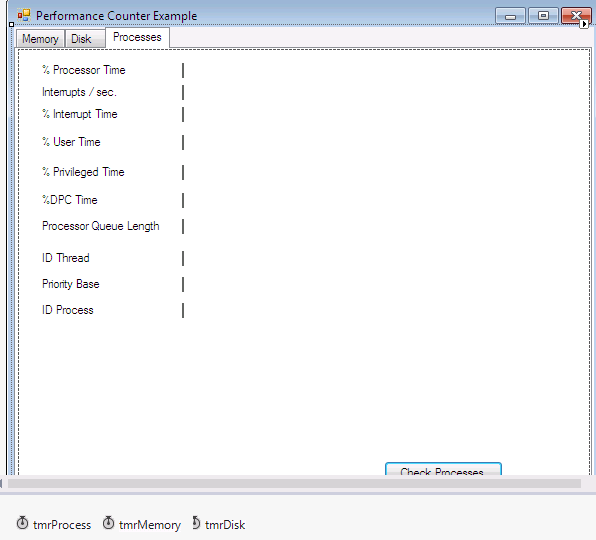
Figure 3 – Process Counters
Coding
There are literally millions of Counters available, as shown in Server Explorer / Performance Counters. I just chose randomly to be honest. We’ll concentrate on Memory, Processor and Physical disk counters.
Let us get started with the Namespaces:
VB.NET
Imports System.Diagnostics 'Contain types that enable you to interact with system processes, event logs, and performance counters
C#
using System.Diagnostics; //Contain types that enable you to interact with system processes, event logs, and performance counters
Let us create our Counter objects:
VB.NET
    Private pcProcess As PerformanceCounter 'Process
    Private pcMemory As PerformanceCounter 'Memory
    Private pcDisk As PerformanceCounter 'Disk
C#
        private PerformanceCounter pcProcess; //Process
        private PerformanceCounter pcMemory; //Memory
        private PerformanceCounter pcDisk; //Disk
Memory
Add the following to cover all Memory Counters in our program:
VB.NET
    Private Sub btnMem_Click(ByVal sender As System.Object, ByVal e As System.EventArgs) Handles btnMem.Click

        tmrMemory.Enabled = True 'Memory Counter

    End Sub

    Private Sub tmrMemory_Tick(ByVal sender As System.Object, ByVal e As System.EventArgs) Handles tmrMemory.Tick

        pcMemory = New PerformanceCounter()

        pcMemory.CategoryName = "Memory"

        'This counter gives a general idea of how many times information being requested is not where the application (and VMM) expects it to be
        pcMemory.CounterName = "Page Faults/sec"
        lblPageFaults.Text = pcMemory.NextValue.ToString

        'Use this counter in comparison with the Page Faults/sec counter to determine the percentage of the page faults that are hard page faults.
        pcMemory.CounterName = "Pages Input/sec"
        lblPageInputPerSec.Text = pcMemory.NextValue.ToString

        pcMemory.CounterName = "Pages Output/sec"
        lblPageOutputPerSec.Text = pcMemory.NextValue.ToString

        'The Pages/sec counter is a combination of Pages Input/sec and Pages Output/sec counters
        pcMemory.CounterName = "Pages/sec"
        lblPagesPerSec.Text = pcMemory.NextValue.ToString

        'This counter is probably the best indicator of a memory shortage because it indicates how often the system is reading from disk because of hard page faults.
        pcMemory.CounterName = "Page Reads/sec"
        lblPageReadsPerSec.Text = pcMemory.NextValue.ToString

        'This is the amount of memory that the process is using that cannot be moved out to the pagefile and thus will remain in physical RAM.
        pcMemory.CounterName = "Page Writes/sec"
        lblPageWritesPerSec.Text = pcMemory.NextValue.ToString

        pcMemory.CounterName = "Available MBytes"
        lblAvailableMemory.Text = pcMemory.NextValue.ToString

        'his counter provides an indication of how NT has divided up the physical memory resource
        pcMemory.CounterName = "Pool Nonpaged Bytes"
        Dim PNBytes As Decimal
        PNBytes = pcMemory.NextValue
        lblNonPageMemoryPoolBytes.Text = PNBytes.ToString

        'This is the amount of memory that the process is using in the pageable memory region
        pcMemory.CounterName = "Pool Paged Bytes"
        Dim PPBytes As Decimal
        PPBytes = pcMemory.NextValue
        lblPageMemPoolBytes.Text = PPBytes.ToString

        'This counter indicates the total amount of memory that has been committed for the exclusive use of any of the services or processes on Windows NT
        pcMemory.CounterName = "Committed Bytes"
        Dim decCommBytes As Decimal
        decCommBytes = pcMemory.NextValue

        lblCommittedBytes.Text = decCommBytes.ToString

    End Sub
C#
        private void btnMem_Click(System.Object sender, System.EventArgs e)
        {

            tmrMemory.Enabled = true; //Memory COunter

        }

        private void tmrMemory_Tick(System.Object sender, System.EventArgs e)
        {
            pcMemory = new PerformanceCounter();

            pcMemory.CategoryName = "Memory";

            //This counter gives a general idea of how many times information being requested is not where the application (and VMM) expects it to be
            pcMemory.CounterName = "Page Faults/sec";
            lblPageFaults.Text = pcMemory.NextValue().ToString();

            //Use this counter in comparison with the Page Faults/sec counter to determine the percentage of the page faults that are hard page faults.
            pcMemory.CounterName = "Pages Input/sec";
            lblPageInputPerSec.Text = pcMemory.NextValue().ToString();

            pcMemory.CounterName = "Pages Output/sec";
            lblPageOutputPerSec.Text = pcMemory.NextValue().ToString();

            //The Pages/sec counter is a combination of Pages Input/sec and Pages Output/sec counters
            pcMemory.CounterName = "Pages/sec";
            lblPagesPerSec.Text = pcMemory.NextValue().ToString();

            //This counter is probably the best indicator of a memory shortage because it indicates how often the system is reading from disk because of hard page faults.
            pcMemory.CounterName = "Page Reads/sec";
            lblPageReadsPerSec.Text = pcMemory.NextValue().ToString();

            // indicates how many times the disk was written to in an effort to clear unused items out of memory
            pcMemory.CounterName = "Page Writes/sec";
            lblPageWritesPerSec.Text = pcMemory.NextValue().ToString();

            pcMemory.CounterName = "Available MBytes";
            lblAvailableMemory.Text = pcMemory.NextValue().ToString();

            //This is the amount of memory that the process is using that cannot be moved out to the pagefile and thus will remain in physical RAM.
            pcMemory.CounterName = "Pool Nonpaged Bytes";
            float PNBytes;
            PNBytes = pcMemory.NextValue();
            lblNonPageMemoryPoolBytes.Text = PNBytes.ToString();

            //This is the amount of memory that the process is using in the pageable memory region
            pcMemory.CounterName = "Pool Paged Bytes";
            float PPBytes;
            PPBytes = pcMemory.NextValue();
            lblPageMemPoolBytes.Text = PPBytes.ToString();

            //This counter indicates the total amount of memory that has been committed for the exclusive use of any of the services or processes on Windows NT
            pcMemory.CounterName = "Committed Bytes";
            float decCommBytes;
            decCommBytes = pcMemory.NextValue();

            lblCommittedBytes.Text = decCommBytes.ToString();

        }
Processes
Add the Process Counters:
VB.NET
    Private Sub btnProc_Click(ByVal sender As System.Object, ByVal e As System.EventArgs) Handles btnProc.Click

        tmrProcess.Enabled = True 'Start Process Counter

    End Sub

    Private Sub tmrProcess_Tick(ByVal sender As System.Object, ByVal e As System.EventArgs) Handles tmrProcess.Tick

        pcProcess = New PerformanceCounter() 'New PerformanceCounter Object

        pcProcess.CategoryName = "Processor" 'Specify Process Counter

        'provides a measure of how much time the processor actually spends working on productive threads and how often it was busy servicing requests
        pcProcess.CounterName = "% Processor Time"
        pcProcess.InstanceName = "_Total"
        lblProcessorTime.Text = pcProcess.NextValue.ToString 'Display

        'The numbers of interrupts the processor was asked to respond to
        pcProcess.CounterName = "Interrupts/sec"
        lblInterruptsPerSec.Text = pcProcess.NextValue

        'This is the percentage of time that the processor is spending on handling Interrupts
        pcProcess.CounterName = "% Interrupt Time"
        lblInterruptTime.Text = pcProcess.NextValue

        'The value of this counter helps to determine the kind of processing that is affecting the system
        pcProcess.CounterName = "% User Time"
        lblUserTime.Text = pcProcess.NextValue

        'This is the amount of time the processor was busy with Kernel mode operations
        pcProcess.CounterName = "% Privileged Time"
        lblPrivilegeTime.Text = pcProcess.NextValue

        'shows the amount of time that the processor spends servicing DPC requests
        pcProcess.CounterName = "% DPC Time"
        lblDPCTime.Text = pcProcess.NextValue

        pcProcess.CategoryName = "System" 'Change to Sysytem Category
        pcProcess.InstanceName = ""

        'provides a measure of the instantaneous size of the queue for all processors at the moment that the measurement was taken
        pcProcess.CounterName = "Processor Queue Length"
        lblProcessorQueueLength.Text = pcProcess.NextValue

        'This counter is a measure of the number of calls made to the system components, Kernel mode services.
        pcProcess.CounterName = "System Calls/sec"
        lblProcessorQueueLength.Text = pcProcess.NextValue

        pcProcess.CategoryName = "Thread"
        pcProcess.InstanceName = "_Total"

        pcProcess.CounterName = "ID Thread"
        lblIDThread.Text = pcProcess.NextValue

        'The thread gets a base priority from the Process that created it.
        pcProcess.CounterName = "Priority Base"
        lblPriorityBase.Text = pcProcess.NextValue

        pcProcess.CounterName = "ID Process"
        lblProcessID.Text = pcProcess.NextValue

    End Sub
C#
        private void btnProc_Click(System.Object sender, System.EventArgs e)
        {

            tmrProcess.Enabled = true; //Start Process Counter

        }

        private void tmrProcess_Tick(System.Object sender, System.EventArgs e)
        {

            pcProcess = new PerformanceCounter(); //New Performance Counter Object

            pcProcess.CategoryName = "Processor"; //Specify Process Counter

            //provides a measure of how much time the processor actually spends working on productive threads and how often it was busy servicing requests
            pcProcess.CounterName = "% Processor Time";
            pcProcess.InstanceName = "_Total";
            lblProcessorTime.Text = pcProcess.NextValue().ToString(); //Display

            //The numbers of interrupts the processor was asked to respond to
            pcProcess.CounterName = "Interrupts/sec";
            lblInterruptsPerSec.Text = pcProcess.NextValue().ToString();

            //This is the percentage of time that the processor is spending on handling Interrupts
            pcProcess.CounterName = "% Interrupt Time";
            lblInterruptTime.Text = pcProcess.NextValue().ToString();

            //The value of this counter helps to determine the kind of processing that is affecting the system
            pcProcess.CounterName = "% User Time";
            lblUserTime.Text = pcProcess.NextValue().ToString();

            //This is the amount of time the processor was busy with Kernel mode operations
            pcProcess.CounterName = "% Privileged Time";
            lblPrivilegeTime.Text = pcProcess.NextValue().ToString();

            //shows the amount of time that the processor spends servicing DPC requests
            pcProcess.CounterName = "% DPC Time";
            lblDPCTime.Text = pcProcess.NextValue().ToString();

            pcProcess.CategoryName = "System"; //Change to System Category
            pcProcess.InstanceName = "";

            //provides a measure of the instantaneous size of the queue for all processors at the moment that the measurement was taken
            pcProcess.CounterName = "Processor Queue Length";
            lblProcessorQueueLength.Text = pcProcess.NextValue().ToString();

            //This counter is a measure of the number of calls made to the system components, Kernel mode services.
            pcProcess.CounterName = "System Calls/sec";
            lblProcessorQueueLength.Text = pcProcess.NextValue().ToString();

            pcProcess.CategoryName = "Thread";
            pcProcess.InstanceName = "_Total";

            pcProcess.CounterName = "ID Thread";
            lblIDThread.Text = pcProcess.NextValue().ToString();

            //The thread gets a base priority from the Process that created it.
            pcProcess.CounterName = "Priority Base";
            lblPriorityBase.Text = pcProcess.NextValue().ToString();


            pcProcess.CounterName = "ID Process";
            lblProcessID.Text = pcProcess.NextValue().ToString();

        }
Disk
Finally, add the PhysicalDisk Counters:
VB.NET
    Private Sub btnDisk_Click(ByVal sender As System.Object, ByVal e As System.EventArgs) Handles btnDisk.Click

        tmrDisk.Enabled = True 'Enable Disk Counter

    End Sub

    Private Sub tmrDisk_Tick(ByVal sender As System.Object, ByVal e As System.EventArgs) Handles tmrDisk.Tick

        pcDisk = New PerformanceCounter()

        pcDisk.CategoryName = "PhysicalDisk"
        pcDisk.InstanceName = "_Total"

        'This counter provides a primary measure of disk congestion. Just as the processor queue was an indication of waiting threads, the disk queue is an indication of the number of transactions that are waiting to be processed.
        pcDisk.CounterName = "Current Disk Queue Length"
        lblCurrDiskQueueLength.Text = pcDisk.NextValue.ToString

        'this counter is a general mark of how busy the disk is.
        pcDisk.CounterName = "% Disk Time"
        lblDiskTime.Text = pcDisk.NextValue.ToString

        'This counter is actually strongly related to the %Disk Time counter. This counter converts the %Disk Time to a decimal value and displays it.
        pcDisk.CounterName = "Avg. Disk Queue Length"
        lblAvgDiskQueueLength.Text = pcDisk.NextValue.ToString

        'This counter is used to compare to the Memory: Page Inputs/sec counter.
        pcDisk.CounterName = "Disk Reads/sec"
        lblDiskReadPerSec.Text = pcDisk.NextValue.ToString

        pcDisk.CounterName = "Disk Read Bytes/sec"
        lblDiskReadBytesPerSec.Text = pcDisk.NextValue.ToString

        pcDisk.CounterName = "Avg. Disk Bytes/Read"
        lblAvgDiskBytesRead.Text = pcDisk.NextValue.ToString

        pcDisk.CounterName = "Avg. Disk sec/Read"
        lblAvgDiskSecRead.Text = pcDisk.NextValue.ToString

    End Sub
C#
        private void btnDisk_Click(System.Object sender, System.EventArgs e)
        {

            tmrDisk.Enabled = true; //Enable Disk Counter

        }

        private void tmrDisk_Tick(System.Object sender, System.EventArgs e)
        {

            pcDisk = new PerformanceCounter();

            pcDisk.CategoryName = "PhysicalDisk";
            pcDisk.InstanceName = "_Total";

            //This counter provides a primary measure of disk congestion. Just as the processor queue was an indication of waiting threads, the disk queue is an indication of the number of transactions that are waiting to be processed.
            pcDisk.CounterName = "Current Disk Queue Length";
            lblCurrDiskQueueLength.Text = pcDisk.NextValue().ToString();

            //this counter is a general mark of how busy the disk is.
            pcDisk.CounterName = "% Disk Time";
            lblDiskTime.Text = pcDisk.NextValue().ToString();

            //This counter is actually strongly related to the %Disk Time counter. This counter converts the %Disk Time to a decimal value and displays it.
            pcDisk.CounterName = "Avg. Disk Queue Length";
            lblAvgDiskQueueLength.Text = pcDisk.NextValue().ToString();

            //This counter is used to compare to the Memory: Page Inputs/sec counter.
            pcDisk.CounterName = "Disk Reads/sec";
            lblDiskReadPerSec.Text = pcDisk.NextValue().ToString();

            pcDisk.CounterName = "Disk Read Bytes/sec";
            lblDiskReadBytesPerSec.Text = pcDisk.NextValue().ToString();

            pcDisk.CounterName = "Avg. Disk Bytes/Read";
            lblAvgDiskBytesRead.Text = pcDisk.NextValue().ToString();

            pcDisk.CounterName = "Avg. Disk sec/Read";
            lblAvgDiskSecRead.Text = pcDisk.NextValue().ToString();

        }
Conclusion
As you can see, working with Performance Counters is quite easy. Explore all of them and then you’ll see how quick these counters can spot bottlenecks in your programs. I hope you have benefited from this article. Until next time, this is me signing off for a while…