

Introduction
If you live in Boston, going to the Fire & Ice Restaurant is a treat because you can create your own special dish from a wide assortment of ingredients and sauces—without having to go through the hassle of preparing the ingredients. NZR Visualization Framework borrows a page from Fire & Ice and offers a developer the ability to tailor the visualization of a wide assortment of data types in a 3D window without having to learn OpenGL or some other complicated visualization library. This tutorial focuses on visualizing point data with NZR and highlights the simplicity of doing so.
Something as innocuous as points can have considerable sophistication when it comes to rendering them in 3D space. Visualizing point data is commonly needed when developing algorithms, scientific data gathering, financial modeling, and so forth. The developer typically has to learn either a complicated graphics package or rely on canned applications. NZR is a new visualization framework announced by SoftServ Intl. Corp. that decouples all data rendering complexity for the developer and offers a very simple API for rendering various types of data. Here, I will present the visualization of point data using NZR Lite, which implements a subset of NZR features. You are encouraged to try out the different attribute settings to explore the applicability to your needs.
Using the code
The point visualization consists of the following steps:
- Instantiate the point data structure.
- Call newObject() to set the default values locally; in other words, in your program.
- Modify attributes locally.
- Call createObject() to instantiate the object in NZR memory.
- Populate the point data array.
- Call writeObject() to transfer the point data to NZR.
- Set the camera at the correct 3D position.
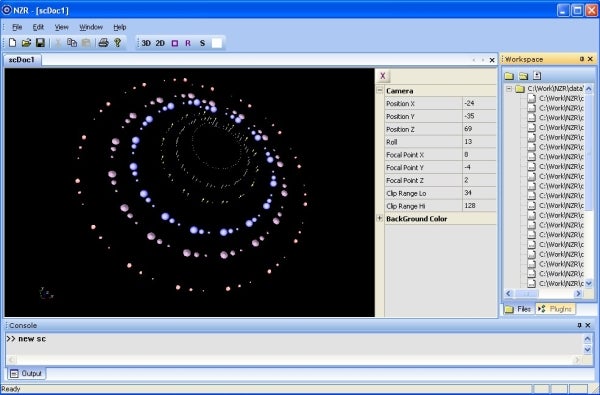
- Call render() to render the data. NZR has different types of cursors to facilitate viewing the data. The main NZR window has a panel that displays camera settings at any point. These settings can be used to establish the correct parameters to programmatically set the camera.
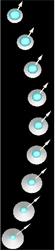
The first example displays the point data using CONE glyphs that have been scaled based on the intensity associated with each point.
#include "nzrLiteClient.h"

   pPointLocations = new nzr_points;

   // Set the default values locally
   myNZRClient->newObject(pPointLocations);    // set default values

   // The default values are the Reference Position of the points
   // in 3D window space, the scale of Points, the color of Points,
   // the opacity of the Points, Light Model Parameters, and the
   // orientation of Points in the 3D window.

   // Any of the above default display attributes can be changed

   pPointLocations->cmnd.display.colorR    = 10;
   pPointLocations->cmnd.display.colorG    = 10;
   pPointLocations->cmnd.display.colorB    = 10;

   // The points can be visualized using glyphs, which are
   // geometrical shapes representing a point
   pPointLocations->glyphType = CONE;
   // valid values are NONE, CONE, SPHERE, CUBE, ARROW, LINE,
   // and CYLINDER

   // Sets the scale of glyphs
   pPointLocations->glyphScale = (float) 0.05;

   // A glyph can be further scaled using either the intensity or
   // vector value associated with each point

   // could also be set to VECTOR
   pPointLocations->glyphScaleMode = INTENSITY;

   // creates the new object
   myNZRClient->createObject(pPointLocations);

   // Initializes an array of points
   float alpha = 20.0;
   float beta  = (float) 0.02;

   pPointLocations->sizeOfData=0;
   for( int t = 0; t < NUMBER_OF_POINTS; t++)
   {
      inputArray[t].x = (float) alpha*sin(t/(float) 10.0);
      inputArray[t].y = (float) alpha*cos(t/(float) 10.0);
      inputArray[t].z = (float) beta*t;    // z value
      // changes the intensity value
      inputArray[t].intensity = (float) (t%10);
      inputArray[t].vx = 0;
      inputArray[t].vy = 0;
      inputArray[t].vz = 1.0;    // point the glyph in + z direction
      pPointLocations->sizeOfData++;
    }

   // Now, write the point values to NZR
   myNZRClient->writeObject(pPointLocations, (void *) >inputArray[0]);

   // Camera is used to set the viewpoint.
   pMyCamera = new nzr_camera;
   myNZRClient->newObject(pMyCamera);    // set default values

   // Override the camera settings
   pMyCamera->FocalPointX  = 0;
   pMyCamera->FocalPointY  = 0;
   pMyCamera->FocalPointZ  = 0;
   pMyCamera->posX         = 0;
   pMyCamera->posY         = 0;
   pMyCamera->posZ         = 100;
   pMyCamera->ClippingNear = 97;
   pMyCamera->ClippingFar  = 103;
   myNZRClient->setCamera(pMyCamera);    // set camera parameter

   // Now, render the point data on NZR display; this will make it
   // visible
   myNZRClient->render();
Link the program with nzrLiteClientLibR.lib. That is all. The NZR Lite should be running with the source doc opened before running the example.
There are a couple of helper functions available to delete either individual object or all objects in the scene. The background color also can be set programmatically.
At times, there is need to represent vector data associated with a point; for example, visualizing the dynamics of a golf swing. The second example shows how this can be done and additional point data presented with a second set of points, but visualized with a different glyph type. Here, vector data is being visualized by enabling the glyphScaleMode to VECTOR and populating the vector data as shown below.
   pPointVectors->glyphScaleMode = VECTOR;
   pPointVectors->glyphType = ARROW;
   ..
   for( int t = 0; t < NUMBER_OF_POINTS; t++) {
       ..
      inputArray[t].vx = (float) 12*sin((float)t/20.0);    // x value
      inputArray[t].vy = (float) 12*cos((float)t/20.0);    // y value
      inputArray[t].vz = (float) 0;                        // z value
A complex point’s data can use a similar strategy of using a combination of color, glyph type, scale mode, and opacity to visually convey sophisticated data values. You will need to download NZR Lite (see the downloads below) and install and run it before running the examples.
Points of Interest
I have also included rendering polylines in the library; you could experiment with these. I will cover visualizing lines with NZR at some later time.
History
August 2007: Initial Release.