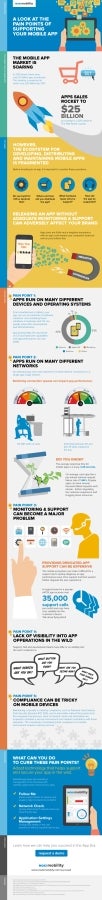

The below infographic was sent to me from MokiMobility. While it has a lot more marketing than I like to include, there were enough other statistics, that I thought it was worth sharing with you. A few tidbits I found interesting:
- Mobile App sales were expected to reach $25 billion in 2013
- Mobile app downloads is expected to quadruple by 2017 (from 50 billion to 200 billion).
- The infographic shows Android with 53% of the market over iOS with 40%. These numbers don’t seem exactly right to me as I know I’ve seen statistics showing the Windows number higher.
- 3.28 seconds is the average response time for a mobile app. Ouch! That is forever when waiting for an app.
You can click on the below image to load a larger version of the infographic.