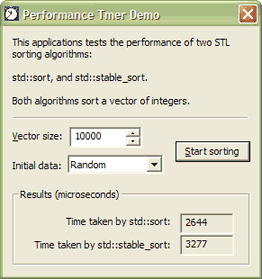
Every once in a while, I’d like to know how fast some piece of code runs. It may be that I’m not sure which of several implementations is the most efficient. Or perhaps I’m just curious.
The classical way to determine the processing time of a code block is by “profiling” it in the debugger. Alas, only a few developer environments have good support for this technique. Visual Studio is not one of them.
What remains is to throw in some timing functions in the code. Retrieve the system time at the entry point of the code block you’re interested in, do it again at the exit point, and calculate the difference. It’s not much work, but it starts to become quite annoying if you have to do it again and again.
I designed the C++ class QPerformanceTimer to avoid this annoyance. Whenever I’m interested in the processing time of some piece of code, I simply include a header, define two variables, and that’s about all there is to it.
How to Use It
Here is how to proceed. Suppose you have some code you want to investigate, let’s say a loop:
// interesting code to set up the loop...
...
for (int i = 0; i < BigNumber; ++i) DoSomethingTimeConsuming();
...
// more interesting code...
The first thing to do is to put the code in a block, if it isn’t already, like so:
// interesting code to set up the loop...
...
{
   for (int i = 0; i < BigNumber; ++i) DoSomethingTimeConsuming();
}
...
// more interesting code...
Next, you define an int variable to receive the elapsed time in microseconds. Also, inside the block, you define a QPerformanceTimer variable. Its constructor takes a reference to the int. This is what you’ll have:
#include "QPerformanceTimer.h"
...
// interesting code to set up the loop...
...
int nElapsedTime;
{
   QPerformanceTimer pt(nElapsedTime);

   for (int i = 0; i < BigNumber; ++i) DoSomethingTimeConsuming();
}
// at this point, nElapsedTime contains the time the code block
// has taken
...
// more interesting code...
Now, when the code block is completed, the elapsed time will be loaded into the int variable nElapsedTime. It can be examined in the debugger, it might be output with a trace statement, or it might be presented to the end user in a UI-element, or whatever.
How It Works
The QPerformanceTimer class is very simple. It has no member functions, just a constructor and a destructor. The constructor determines the starting time, and stores it in a member variable. The destructor retrieves the stop time, calculates the elapsed time, and stores it in the associated int variable. That’s about all.
To get the time values, the “high-resolution performance counter” is used. This is a 64-bit hardware timer, which is initialized to zero at system start up and is incremented with a steady pace as long as the system is running. Windows offers two API-functions to query it:
- QueryPerformanceCounter() simply gets you the current value of the counter in other words, the number of ticks since computer start-up;
- QueryPerformanceFrequency() gets the counter frequency in counts per second.
My class uses these two functions. It’s just a matter of multiplying the elapsed ticks with one million, and dividing by the frequency, to get the elapsed time in microseconds. To make it more user-friendly, the resulting value is converted to an int.
Consequently, the maximum time to be measured is slightly over half an hour, but this will be more than adequate for most situations. If an overflow occurrs, or the system doesn’t support a performance timer, the associated int is loaded with -1.
The code for QPerformanceTimer is just in one small header file. Of course, its usage is limited to Windows (from Windows 95), but other than that it’s quite portable. It can be used with MFC, ATL, or even in pure Windows API programs. It’s written in VC++ 7.1 (.NET 2003), but I have no reason to believe that it can’t be used in VC++ 6.0 or 7.0.
Demo
The demo is nothing special. It’s a dialog-based MFC application that measures the time taken by some lengthy processes.
To make it mildly interesting, I used the opportunity to test the performance of two standard algorithms of the STL: std::sort() and std::stable_sort().
The first one is a general sort routine, and may mix up identical elements. The second one is, as its name implies, “stable,” and preserves the order of identical elements. You typically use it to sort elements that have been sorted already by some other criterion. Generally, but not always, std::stable_sort() is less efficient than std::sort().
The demo exposes the difference between the two algorithms. It’s also very instructive to compare a Debug build and a Release build of the demo. The difference in speed is huge.
For another use of QPerformanceTimer, albeit an older version, take a look at my article on Delaunay Triangulation.

