

By Adnan Masood
One ought, every day at least, to hear a little song, read a good poem, see a fine picture, and if it were possible, to speak a few reasonable words
-Goethe
SVG is an established yet emerging W3C standard for scalable vector graphics. It’s an implementation of XML, a grammar for style-able graphics, and a no-nonsense, plain text vector format. Equipped with UTF-8 multilingual coding, scripting, and animation support, SVG holds huge potential for engineering, geographic mapping, drawing and animation, GPS information systems, and charting solutions.
This article explains step-by-step the server-side manipulation of SVG using Microsoft ASP.NET and C#. The example server-side application demonstrates how simple and complex maps can easily be represented using SVGs. This writing includes explanations of all source code and will show how SVG can be updated on the fly from a database. There is a complete case study and implementation with code. SVG mobile profiles are also briefly discussed. This article assumes you have an understanding of XML and server-side programming.
Today, displaying maps, either on the desktop or handheld devices, involves using static gifs or other raster formats. These formats lack the capability of real-time updates and interactivity. Using SVG makes maps smarter and simpler so they can reflect changes concurrently and enhance the user experience. Users can actually toggle the un-wanted material, for instance a particular landscape, water, rail or trees, from the display and concentrate on specific freeway directions. With live server updates, an SVG map can be a important asset, detailing on-the-fly travel changes, not just as text, but in the form of a picture, worthy of thousand words!
A quick refresher course: what is a vector in SVG, and why is it special? There are two types of graphics in principle, raster and vector. The difference between a bit-mapped (raster) versus vector graphic is in representation. Bit-map, as the name suggests, stores the information about each and every pixel. Major disadvantages of this approach are pixilation on resolution change and gigantic file sizes. When using complex compression algorithms, for instance, jpg, the chances of seeing bit-mapped images on devices with low CPU power and memory restrictions like cell phones are unlikely. Similarly when changing resolutions, altering dpi or zooming in, images gets pixilated (blurred, broken, chunky).
On the contrary vector images are created from a set of geometric instructions, so they can be resized and still keep the sharp edges. This is why SVG images can be resized without any loss in image quality. Unlike bit-map images, SVG graphics are not created using coloured pixel positions. In contrast to raster images, SVG is scaleable, i.e. when an SVG image is resized, the image actually is redrawn to the new proportion according to the new transformation. Postscript documents, Windows meta files and Corel draw are typical examples of vector image formats. An interesting paper comparing SVG and Flash formats exists in greater detail at http://www.carto.net/papers/svg/comparison_flash_svg.html and file format comparisons of SVG, Flash and CAD images can be seen at http://www.square1.nl/TGC-SITE/vector/vector-gallery.htm.
On 5 September 2001, Scalable Vector Graphics (SVG) 1.0 became a W3C Recommendation: (see http://www.w3.org/Graphics/SVG/Overview.htm8). SVG, as described by the W3C, is an XML-based protocol useful for displaying 2D vector graphics. This includes shapes, graphics, and text, allowing a number of effects, such as styling, clipping, filtering, alpha masks, etc.
An SVG image is, essentially, an XML-formatted text file. An SVG image viewing program, or plug-in, can translate this XML grammar into a graphical image. There is no built-in support in Web browsers for SVG files; therefore, in order to view an SVG image, you need to install an SVG image viewer plug-in. Several plug-ins are available, such as the Adobe SVG Viewer which is available at http://www.adobe.com/svg. Once this plug-in is installed, one can view SVG graphics, locally or remotely. Since SVG graphics are constructed from text, it is possible to easily generate these graphics on the fly using any server-side scripting model like ASP, Perl or JSP. This offers great possibilities for flexible graphical applications on the Web and desktop. Some of the possibilities will be explored in this article with code fragments and explanation.
Comparing a Flash file format (.swf) to SVG is also a common practice. Besides several similarities, there are fundamental differences too. The first and foremost difference is that SVG is an official W3C standard while SWF is not, one promoting open development and vice versa. SVG is an implementation of XML, while SWF provides functionality to manipulate DOM; it is not an XML grammar. A detailed comparison matrix can be found in the notes section of this article.
SVG implicitly supports indexing because similar to other W3C standards, SVG is created using plain text. SVG text is fully searchable so the images generated by SVG can be indexed by search engines. SVG is an application of XML, period. It exploits the flexibility and power of XML and related technologies. Developers can utilize the potential of CSS, namespaces, XLink, XSLT, SMIL and DOM in SVG as an XML grammar. In this article, I’ll be emphasising the server-side manipulation of SVG, specifically in maps. The “further readings” section is well equipped with loads of links that will surely help with other areas.
A Pretty Basic SVG File
<rect width='100' height='100' x='50'
In both XML and layman jargon, SVG is simple (text oriented) and well-formed. Basic.svg is a simple XML file that demonstrates drawing a rectangle using SVG. The file is composed of an XML namespace declaration, writing text element, and declaration for rectangle. SVG syntax is quite intuitive and self descriptive. In the text tag, x and y is the starting position from the left-top corner of the SVG canvas, followed by written text as markup. Rectangle follows standard practices of various graphics libraries, initial coordinates, fill colour, width and height!
<?xml version="1.0" encoding="UTF-8" ?>
<svg width="100%" height="100%"
>
<text x="20" y="20"> Welcome to SVG </text>
y='50' fill='green'/>
</svg>
Listing 1.1 - Basic.svg
The figure above shows a simple green rectangle and text message in a browser; remember there is no native support for SVG in Web browsers at this time. Hopefully in near future we may have built-in support in IE and Mozilla.
Serving SVG Files Using Classic ASP
<rect x="10" y="10" width="50" <circle cx="100" cy="40" r="20"
Serving SVG dynamically to provide interactivity is the very goal of this article. In Classic ASP, things were less abstract. To satisfy my conformist zeal, I even enjoy using asp 3.0 files as batch programs to remind me of the old console days. In order to serve SVG through an ASP page, one needs to set the MIME type in the HTTP header. MIME, Multipurpose Internet Mail Extensions, lets our Web client (browser) understand what file is going to be served and what should be the interpretation mechanism. (See appendix for MIME type's detection in IE, MSDN article).
<!-- Filename classicsvg.asp -->
<%Response.AddHeader "Content-
Type","image/svg-xml"%>
<svg>
height="50" stroke="red" fill="blue" />
stroke="red" fill="blue" />
</svg>
Listing 1.2 - classicsvg.asp
Setting the MIME type in HTTP headers is a ubiquitous practice in professional Web applications for serving different data types. For instance, to serve binary data images, HTTP headers are set to image/jpeg or image/gif. When binary data is served, browsers distinguish and interpret the graphic respectively. SVG's MIME type is image/svg-XML. This is added in the OS registry during installation of the SVG plug-in. When content pertaining to this MIME type are being sent to the browser, it recognises this automatically and displays it using the SVG plug-in.
The HTTP Response's content type is set via ASP's implicit object, Response's AddHeader method. It takes a typical key value pair and sets headers accordingly.
The other statement listed is for drawing a circle. Like rectangle, the mark-up for circle takes x, y and radius. To spice up things a bit, I added optional parameter stroke, i.e. line colour and fill-in.
Embedding-Going .NET
</html> <svg>
In addition to setting the content type, there are other methods, including IFRAME and using embed or Object tags, to show SVG files. Embed/Object tags reference external files, for instance multimedia audio files (.wav), midi sequencers (.midi) , flash (.swf) or vector graphics SVG files. An HTML page must contain tags that reference the actual file to be opened and played. The OBJECT tag is used by Internet Explorer on Windows and the EMBED is used by Netscape Navigator (Mac and Windows).
The next example shall demonstrate executing an aspx (ASP.NET) file from an HTML page and rendering the results through the SVG plug-in. It may seem tricky but looking at the few lines of code, it's quite easy to understand the role of the embed tag in the execution of the ASP.NET page. Testembed.htm is the file requested by browser. This file contains an embed tag which refers to an aspx document.
<html>
<embed height="400" width="400" src="http://localhost/dir/svg/embed/htmlembed/classicsvg.aspx"
pluginspage="http://www.adobe.com/svg/viewer/install/" type="image/svg+xml" />
Listing 1.3 - testembed.htm
Notice that the source attribute of embed refers to the aspx page using a complete server-qualifying URI. This is because an aspx file needs to be executed via IIS in order to generate a response, unlike an HTML page, which can be accessed and executed locally. Having said that, readers will notice that embedding the aspx file that returns an SVG document is the first step towards dynamically serving SVG. Classicsvg.aspx has the svg code which can easily be manipulated using some ASP.NET programming skills.
<!-- Filename classicsvg.aspx -->
<%Response.AddHeader("Content-Type","image/svg-xml")%>
<rect x="10" y="10" width="50" height="50" stroke="red" fill="blue" />
<circle cx="100" cy="40" r="20" stroke="red" fill="blue" />
</svg>
Listing 1.2 - classicsvg.aspx
This manipulation capability of SVG through ASP.NET could allow us to parameterise data, which is the key technique to dynamically generating graphs and charts showing real-time statistics.
This picture above shows the output of classicsvg.aspx through a simple HTML file. It's not much different from what we have seen above in the classic asp example; it's just another way of presenting data.
Multiple Page Parameter Passing - SVG Using a File Controller
To make SVG-based graphs, charts, or even text interactive, parameters need to be passed into the code. There are various real-life applications that work on the principle of reading data from a server and continuously displaying updates. Bloomberg stock quotes, news channel Web site tickers, or your local weather desktop application, they all work on a similar principle -- request data from a server, generate stubs, marshal parameters, get it through the wire, de-marshal it, parse it and assign it to respective functions to update displays or whatever is needed. SVG is no different.
Drawing shapes is mundane, so I decided to improve them by using height as a variable parameter. The sandwich of ASP.NET and SVG code gets interesting. When we pass an argument via query string, i.e. GET method of HTTP, an ASP page can request it by using an implicit request method. This is how we pass the height variable in SVG code. We also introduce a controller aspx page, which also passes parameter to the embed tag. Yes, it reads the filename from the query string and passes it on to the embed parameter. This generic controller can be used to embed/view any .svg file.
Syntax is similar to http://localhost/dir/controller.aspx?filename=<filename>. At the same instance, the file which will be used by the controller, basicaspsvg.aspx, also takes a parameter. Yes. We are passing two parameters in the same query string, filename and height for rectangle. For clarity, I didn't make more of them variables, for instance width and position, but there is always room to do it.
<%@ Page ContentType = "image/xml+svg"%>

<svg width="100%" height="100%" >

<rect width='50' height='<%=Request("h")%>' x='50' y='50' rx='5' fill='blue' stroke='red' />

</svg>
Listing 1.4 - basicaspsvg.aspx
|
Listing 1.5 - controller.aspx
Now the query will look like http://localhost/dir/controller.aspx?filename=<filename>?h=150 . It might be surprising to see two question marks there because usually parameters are separated by the ampersand '&' sign. It's different in this case because the parameters are different for both files. Controller will read the filename and discard the rest of the query string, which will be used by the embedded page, basicaspsvg.aspx. This file will read the part that pertains to height and implement it. By changing the value of h (i.e. height variable) in the querystring, you can easily visualize corresponding changes in the rectangle's height; this is how SVG dynamically works. In practice, this is how weather and temperature graphs are dealt with. Calibration of a Centigrade/Fahrenheit scale and displaying it online is a common practice; just keep in mind how easy it wold be with SVG.
Being Sophisticated - Using ASP.NET Web Forms with SVG
Now that we've completed several trivial (but conceptual) examples, it's time to play hardball! ASP.NET has lots to offer, and our major objective is dynamic content provisioning for SVG. But at this point, I'd like to write a bit about ASP.NET features and enhancements and how they differ from classic ASP. All of us in the programming world are aware of ASP.NET; it's entirely a new arena with .NET's extensive framework library. Providing flexible languages, compiled execution, and rich output caching, ASP.NET has excellent support for imaging libraries (no more components to buy), managed code, and different device support, i.e. mobile and PDAs. Code behind, deployment ease, and persistence of data during page transitions are just some of the advantages afforded to an ASP.NET developer. I'll explain throughout the article some frequent ASP.NET Web development tasks (WebForms, data binding, ADO and forms handling). All of these will be used to provide richness and interactivity to our beloved SVG.
As seen earlier, parameters can easily be passed using a query string. When programming for ASP.NET, session persistence is handled automatically, keeping the programmer away from mundane housekeeping. The closest analogy of ASP.NET web fronts are Visual Basic forms. A form or HTML control marked with the runat="server" attribute informs ASP.NET that it will be posting back data for use in server code. The controls are declared on the server, can be programmed against on the server, but can be event-driven from the client. All we have to do to turn a normal HTML control into a server control is add runat="server" as an attribute.
Let's take it one by one. Our goal is to design an HTML page with a form on it. This form will takes width, height and radius -- first two are for rectangle, and the last one is for a circle -- and draws them accordingly on the same page. This may sound a bit confusing because two different MIME types will be merged in one module. Using the embed tag provides us enough flexibility to handle such tasks.
The listing for the above form is below. It has a simple ASP.NET script block, a typical page load event, and an event that will execute when the button is pressed. Pressing the update button calls the ButtonClicked event as described in code below.
<ASP:Button id="button" width="60" text="update" onclick="ButtonClicked"

runat="server" />
The event procedure is automatically supplied with two parameters - the control that generated the event and any additional arguments the procedure requires. Since this is a server control, this event procedure runs on the server. The next step is interesting. As mentioned earlier, any HTML tag can contain the runat=server attribute; embed is no exception. Using svgembed (the id of embed tag used in this page), we can set its attributes at runtime. .NET libraries have made this easy to do. No DOM parsing, no strings to manipulate and no character searching, no regular expressions when you don't need them; just use svgembed.Attributes["src"] and consider it done. Since all the text boxes also have the runat=server attribute, their values can be accessed from any method defined in a server-side script block. Therefore, by reading width, height, and radius from those textboxes, we can design a query string according to our needs and send it to squarecircle.aspx, which is the file that reads parameters and puts them in SVG statements.
The point of all this is to be able to visualise how easy it is to use ASP.NET and how different it is from classic ASP. Unlike traditional GET-POST handling, string manipulations, regular expressions or match finding techniques, .NET framework libraries have the power to seamlessly manipulate the contents. System.Web.UI.HtmlControls.HtmlGenericControl in general and System.Web.UI.HtmlControls namespace in specific have a lot of raw power to exploit. From Tagname to attribute manipulation, this class has made several frequently used tasks easier to implement. DOM readings are history, and you have more command over markup.
|
Listing 1.6 - webform.aspx
|
Listing 1.7 - squarecircle.aspx
Changing parameters will display rectangles and circles of various radii, widths, and heights.
London Underground Map - A Case Study for SVG and ASP.NET
The case study for this article is the London Underground system, one of the biggest and complicated subway networks in Europe. They have an excellent Web site (http://www.thetube.com/) for everything about the Tube system, from buying tickets to area attractions and from tube-planner guides to service updates. Let's see how implementing an SVG-based map can provide interactive travel updates.
The London Underground Tube Map
example: Chancery lane station is open Monday to Saturday (closed on Sundays) ALTER TABLE Stations CREATE TABLE stations_tube ( ALTER TABLE stations_tube ALTER TABLE stations_tube ALTER TABLE stations_tube
To visualize with clarity, we will discuss some zone1 stations, focusing on central and circle lines. Travel updates are information about the network's status. Due to engineering work, developments, security alerts and other reasons, stations get closed and tubes have delays or temporary suspensions once in a while. I'll describe how to reflect one of the following scenarios in detail and show the other two in practice.
Pre-scheduled Closures
On the fly Suspension
example: Security alert on a central line station, no trains stopping in both directions.
Sporadic Disruption
example: Due to engineering work on King's cross St. Pancras station, there will be no service between Liverpool Street and Baker Street most weekends.
Database Schema for Tube Database
This schema is designed to show SVG's dynamic qualities and ASP.NET's database handling capabilities. It's not a very well thought out one, but it will do the job. Table Tube consists of tubetitle (text), status (its running status i.e. Boolean) and path, which is variable for storing the SVG path for future use. In the stations table the stationtitle field stores the name of station, status is its current availability, message is an optional field for displaying any particulars regarding station (west minister station will be closed from 20:00 on 31st Dec for safety reasons due to party at Big Ben). Svgx and svgy are fields for storing x and y parameters for stations. Since one tube serves several stations and a station is served by many tubes, it's a many to many relationship.
The cardinality of this relationship automatically brings the stations_tube table in physical view. This table defines the relationship between a station and the tube it serves.
This database is in SQLServer, but MS Access, MYSQL, Oracle or any other database can easily be used. I'd like even to try flat files for testing purposes, but it may not be feasible when it comes to large amounts of simultaneous updates and changes.
The SQL code for schema and screenshots for running batch scripts for data insertion in SQL Server enterprise manager is shown below.
CREATE TABLE Stations (
stationtitle varchar(256) NOT NULL,
status bit NULL,
svgx int NULL,
svgy int NULL,
message varchar(512) NULL
)
go
ADD PRIMARY KEY NONCLUSTERED
(stationtitle)
go
title varchar(256) NOT NULL
)
go
ADD PRIMARY KEY NONCLUSTERED (title)
go
CREATE TABLE Tube (
status bit NULL,
path varchar(2048) NULL,
tubetitle varchar(256) NOT NULL
)
go
ALTER TABLE Tube
ADD PRIMARY KEY NONCLUSTERED (tubetitle)
go
ADD FOREIGN KEY (title)
REFERENCES Tube
go
ADD FOREIGN KEY (title)
REFERENCES Stations
Go
Listing 1.8 - schema.sql
Displaying Tube Map - Image Handling in SVG
Here is a simple listing that shows the London Underground map (in short tube map) in SVG. First are XML declarations and then the SVG Image tag declaration.
<image x="0" y="0" width="1100" height="584" xlink_href="tubemap.JPG" />
This takes initial position, x and y, width and height, and path of tube map.
|
Listing 1.9 - tubemap.svg
Output of Listing 1.9
First Things First, Marking Stations with Condition
There could be several semaphores that represent a problematic station, i.e. various other legends, etc. I decided to mark one with a grey block. It's just a rectangle at the corresponding coordinates.
<rect x="701" y="224" width="15" height="18" fill-opacity="0.1" />
The attribute fill-opacity is the degree of fill transparency. It uses values from 0 to 1.
|
Listing 1.10 - tubemap-stationmarking.svg
The output of the above code is the map below. Look at Chancery Lane station; it has a block on it, indicating a specific problem. There also could be a legend for coloured blocks, with red blocks for the fire alert, green for passenger action, blue for closure due to signal failure, etc. For further extensibility, images can also be used instead of coloured blocks.
The Tube Control Panel - Data Binding & Manipulation Using ASP.NET
This panel has tubes and stations listed in two separate list boxes. This is the advent of database schema we created earlier in the program. Those tables were filled with station and tube information and then bound with list boxes in the ASP.NET page. This control panel could be used to toggle the stations' and tubes' status. Pressing the toggle status button updates the stations or tube table setting status field to either zero or one. This status bit is read by the server page, which displays the map and shows possible problems. When this bit is set to zero, the station will be shadowed as described in the example above. Only this time it will be automated.
When you weren't looking, I created a control panel for our program:
.NET Framework libraries have made database handling, operations, and manipulating much easier. This will be apparent in the forthcoming text.
The Control Panel page's life cycle starts with the page_load event when controlpanel.aspx is requested. On first call, this method fills station and tube list boxes with data from the respective tables. To perform this data request operation, our method establishes a connection with the database by instantiating an object of the SqlConnection class. This is why the SqlClient namespace is imported in the application.
<%@ Import Namespace="System.Data.SqlClient"%>
The SqlConnection constructor takes the connection string as an argument. Since this string is supposed to be used in various pages, to make changes easier and to follow standard development practices, it's stored it in Web.config file. It can be accessed by using ConfigurationSettings.AppSettings, which takes a variable name as an argument.
SqlConnection con = new SqlConnection (ConfigurationSettings.AppSettings["connString"]);
This should match the name by which the connection string is stored in the Web.config file. For details see Listing 1.12 - web.config file.
After connection to the database is established, an object for executing a simple SQL query is instantiated and has SQL assigned to it. This SQL will read title and status from the tube table.
cmd = new SqlCommand ("Select tubetitle Title, Status RunningStatus FROM tube",

con);
On successful execution of the query, this resultset will be assigned to listbox1, i.e. the tube list box datasource attribute.
listbox1.DataSource = cmd.ExecuteReader();
Listboxes and datagrids are "Data Aware" components, i.e. they have built-in mechanisms to handle recordsets and single dimension displays. For instance, listbox can display a particular field that needs to be defined as an attribute.
listbox1.DataBind();
Field definition is given in the client side code in the attribute of DataTextField and DataValueField.
<asp:ListBox id="listbox1" runat="server" DataTextField="title" Rows="10"

DataValueField="title"  />
This datasource binding is not limited to a database. It could be an array, active directory, or any enumerated IElements collection.
This process is repeated with stations; these statements are in the NOT IsPostBack block to make sure they execute only once, i.e. when the page is instantiated or when the form is not posted. Later on the function void
showUpdatesGrid() handles listbox updates for the rest of the page's life.
When station's toggle tube status button is pressed, it invokes _toggleStationStatus method, which opens a connection to set the status attribute of stations table to either zero or one, depending on its previous state. This function first checks whether a station is selected or not; later it establishes a connection as defined earlier. The only difference this time is the execution of DML (Data manipulation query), rather than a simple read-only select query. The table will be updated.
query = "update stations set stations.status = ~stations.status where

stationtitle='" + listbox2.SelectedItem.ToString() + "'";

		  cmd4 = new SqlCommand (query, con1);

		  cmd4.ExecuteNonQuery();

		  con1.Close();

		  showUpdatesGrid();
This query will update the station assigned in listbox2.SelectedItem. But since this query is nothing more than a data manipulation SQL statement, the update statement is ExecuteNonQuery(). After this update, showUpdatesGrid()function is invoked to update the display grid.
This update is for an associated datagrid control display; there are two grids below, listbox1 and listbox2. The listboxes display the station and tubes list, while the datagrids display the problems.
if (IsPostBack)

<asp:label id=lbl2 Font-Size="10" runat="server" /> <br>

<asp:datagrid id=problematicStations Font-Size="10" runat="server" />

}
These grids are updated using the showUpdatesGrid function, which reads the information from the database for the stations whose status is zero (or down).
cmd4 = new SqlCommand ("Select stationtitle STATION, status STATUS FROM stations

where status=0", con2);
The figure portrays how it would look when Holborn station is facing problems; the data grid will show the station and status fields from the stations table.
myReader = cmd4.ExecuteReader();if (myReader.Read()) { // if all stations are NOT operating normally
myReader.Close();
problematicStations.DataSource = cmd4.ExecuteReader(); // Show Grid
problematicStations.DataBind();
problematicStations.Visible=true;
lbl2.Text = "Some Problems have Occured - Details Below";
}
A reader is introduced to check the recordset size greater than zero and then assign the datasource attribute of the grid to the datasource. This grid and label status will be shown in the form below with values assigned from server.
<asp:label id=lbl2 Font-Size="10" runat="server" /><asp:datagrid id=problematicStations Font-Size="10" runat="server" />
Datagrid problematicStations will hold the list of all problematic stations for administrators to see and toggle. The same process is repeated for tubes. Below is the complete control panel listing.
|
Listing 1.11 - controlpanel.aspx
Doing It Dynamically - Marking Stations & Going Live
Now as shown in the figure above the previous listing, pressing "Toggle Status" on Holborn station will set the status to zero. To see the updates, a user will request the tubemapServer.aspx resource. This file's sheer purpose is to read the updated values from the database and show the changes on the map. For this purpose, it works in association with tubemapcoordinatemarking.aspx, which handles reading and marking tasks. One important point about this model is its efficiency in terms of byte size. The whole image won't be downloaded onto output devices every time, just the updated SVG file. This capability static raster file formats lack.
Our main functioning file, tubemapcoordinatemarking.aspx, contains a page scope variable resultString, which holds the complete SVG string that is written down to the file for marking problematic stations. In order to read the coordinates of problem stations, a query is executed inside page_load event.
cmd = new SqlCommand ("Select stationtitle, status, svgx, svgy FROM stations
WHERE status=0", con);
The difference this time is the recordset will not be bound to any part of the component. Instead, it will be iterated programmatically to create a string for SVG. Alternatively a template iterator approach could be used to perform this task. A reader object is created and iterated. The result string is created to hold stations and their coordinates along with SVG syntax for drawing boxes over it.
SqlDataReader objDr;// = new SqlDataReader();

objDr = cmd.ExecuteReader();

while (objDr.Read()) {

		resultString = resultString + "<a xlink_href='#" + objDr["stationtitle"]+"'>";

		resultString = resultString + "<rect x='"+objDr["svgx"]+"'

y='"+objDr["svgy"]+"' width='25' height='25' class='hs' fill-opacity='0.5' />";

		resultString += "</a>";

	}

}
These SVG lines are stored in a result statement and later returned via the ShowStationsStatus()function.
public String ShowStationsStatus() {

	return (resultString);

}
This map shows Holborn station marked with a square box. To test this approach, I will make Tottenham Court station problematic, which is reflected in the datagrid below.
Changes are reflected accordingly in the tubemapcoordinatemarking.aspx file simultaneously. Live updates of the database are reflected on the map, and Tottenham Court Road station is now also marked with a grey box.
This time the approach is two way, I am setting a station, Bond Street, as problematic and setting Holborn as normal. This will leave Tottenham Court Road station as problematic along with Bond Street. When the page is requested, change will instantly be reflected on the SVG map as shown in the diagram and table below.
|
|
|
The technique for drawing rectangles with opacity was defined above. I only have entered a few coordinates in the database; more could be entered and used by the developer in future extensions.
Complete code listing is given below.
|
Listing 1.12 - web.config
|
Listing 1.13 - tubemapcoordinatemarking.aspx
|
Listing 1.14 - tubemapServer.aspx
Animation in SVG
Animation has been the focus of SVG since the beginning. W3C's specification defines the SVG animation capabilities in detail along with syntax and semantics (http://www.w3.org/TR/2000/CR-SVG-20000802/animate.html). SVG animation is regarded as a host language for SMIL (Synchronized Multimedia Integration Language) and hence follows the SMIL Animation specification. For details on SMILANIM (http://www.w3.org/TR/2000/CR-SVG-20000802/refs.html#ref-SMILANIM)
For animation in SVG, the 'animateMotion' element causes a referenced element to move along a motion path. To define a path, several elements are used, for instance, M for moving the cursor to a certain point, L for drawing a line to a certain place, etc.
A table for some of the commonly used commands for describing a path is below.
For starting an animation, the animate tag needs a begin time, duration, and repeatcount. When set to indefinite, it will run the animation for an infinite period of time.
<animateMotion begin="0s" dur="10s" repeatCount="indefinite">

<mpath xlink_href="#circleLine"/>

</animateMotion>
The animation's trajectory will be referenced using mPath for the object's movement.
<use xlink_href="#circletrain">
In our case two trains, central and circle lines, are defined as red and blue rectangles, with height and width of eight units.
<rect id="centraltrain" x="0" y="-4" width="8" height="8" style="stroke:black;fill:blue;"/>
The result of the path in tubemapsimpleanimation.svg is seen is the map below. It has two animated trains (two circled rectangles) running down the lines.
Complete listing is included for demonstration purposes.
|
Listing 1.15 - tubemapsimpleanimation.svg
Now let's see what happens when stations are closed on the weekends. We are again using two files, closureparameter.aspx and closureServer.aspx. Below is the view of normal Monday services when closureServer.aspx is requested from the browser.
The animated-trains-running-down-the-track scenario changes on weekends when we have circle line closure between Liverpool Street and Edgware Road. Now this is where our two partners, ASP.NET and SVG, come into play and manipulate the scheduled listings. DateTime enumeration is defined in detail in MSDN, (http://msdn.microsoft.com/library/default.asp?url=/library/en-us/cpref/html/frlrfsystemdayofweekclasstopic.asp). Here I'm using the DayOfWeek enum type to find out the weekend.
The file will see if the weekend is true and serve parameters accordingly. The weekend command line parameter will be set to false if it's neither Saturday nor Sunday, true if it is Saturday or Sunday.
<%DateTime dt=new DateTime();

DayOfWeek temp = dt.DayOfWeek;

String weekend="false";

if (temp == DayOfWeek.Saturday || temp == DayOfWeek.Sunday )

weekend="true";

%>

<p align=center><b><%=DateTime.Now + " "+ temp%></b></p>

<embed id=svgembed

src="closureparameter.aspx?weekend=<%=weekend%>" height="584"

width="1100" pluginspage="http://www.adobe.com/svg/viewer/install/"

type="image/svg+xml"/>
Here our beloved closureparameter.aspx will read the query string and act accordingly.
Boolean weekend = Boolean.Parse(Request["weekend"]);

Response.Write (weekend);

if (!weekend) {
I changed my server's datetime to Satuday. Now it's the weekend, let's make the map a bit different! This time people shouldn't try to go to Baker Street this way unless they want to ruin their day!
Looking at the map above, it's obvious that there is no service between Liverpool Street and Edgeware Road. And so there is no animation in between. It doesn't take a 130 IQ to understand there would be no train running in between.
Complete listing for both files is provided below.
|
Listing 1.16 - closureServer.aspx
|
Listing 1.17 - closureparameter.aspx
SVG Goes Mobile!
The best things about the community development process are participation, zeal, ideas, and continuous improvement. As mentioned in W3C's Mobile SVG profiles document "The mission statement of SVG 1.0 specifically addresses small devices as a target area for vector graphics display". In contrast with other vector graphic formats (SWF, CDR), SVG is easiest to manipulate on limited memory and CPU power devices. SVG is an open standard, and since it's plain text, any XML editor or even a simple text editor can be used to make modifications. So in the field, an engineer can easily view aerial maps, perform calculations, edit and make changes on pocket devices.
On 14th Jan 2003, the Mobile SVG profiles document was released. It categorises small devices into two types for addressing their specific needs. These specifications, formally stated as profiles, are SVGT (SVG Tiny) and SVGB (SVG Basic). The first profile SVGT, is a smaller subset of the specification and suitable for highly restricted mobile devices. The SVGB specification takes it further to maximize compatibility and target higher level mobile devices.
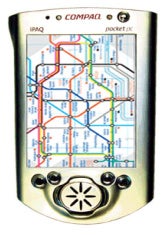
SVG for mobile is growing. There are a few toolkits available to implement SVG mobile profiles for handheld devices. One of them is PocketSVG (http://www.pocketsvg.com/), "a toolkit for developing applications on Windows CE devices". Its an ActiveX control which helps developers build applications for displaying SVG content on portable devices like Pocket PC.
With the addition of another attribute, a base profile in the SVG file listing, this simple text file can be ported to a typical mobile SVG viewer like Pocket SVG.
<svg:svg width="4cm" height="8cm" version="1.1" baseProfile="tiny" >
PocketSVG is written in C++ (around 700kBytes in size). This toolkit contains "the ActiveX control and associated libraries, sample files, a standalone viewer and sample source code". PocketSVG implements the SVG Tiny specification described above. As stated in its documentation, one can "view local and remote SVG documents, view SVG images and use the provided ActiveX control when developing your own custom applications."
The development team has tested PocketSVG on Compaq iPAQ H3630, which has an ARM SA1110 processor and Windows CE version 3.0.9348,Compaq iPAQ running Pocket PC 2002, HP Jornada 548 and Cassiopeia EM-500. The development team has also built PocketSVG for the CE .NET platform (Windows CE 4.0).
Mobile SVG's future looks bright, provided that mobile vendor participation will be inline. With potential in the vector graphics field and its usage in engineering, science and various other navigational services, this new arena of SVG on handheld devices will grow fast.
Recent news on SVG (http://www.internetnews.com/dev-news/article.php/2226941) covered integrating SALT with SVG to facilitate voice-based interfaces for handheld devices. SALT (Speech Application Language Tags) is an extension to markup languages, an XML grammar, and lightweight specification to add speech interfaces to the Web and handheld devices. To exploit the full potential of Web technologies and the application model, the profile recommends embedding SALT into SVG to create smart clients. As stated in the profile:
"It is recommended that when embedding SALT into SVG with CSS and/or SMIL in use, all the SALT object behaviors under CSS and/or SMIL are identical to those already defined in Section 2.8 of the SALT 1.0 specification.
It is further recommended that a. full implementation of SVG 1.1 is treated as a rich client of SALT, and the SVG Basic and SVG Tiny be treated as smart client with and without scripting, respectively, with all the modules defined in SALT 1.0 specification made available in accordance with the SALT conformance guidelines"
SVG is great for handheld devices with limited memory and processing power because of its simplicity, so is SALT. It's indeed easy for SALT to interact with SVG because of its dynamic properties. Also, speech engines on limited processing power can parse tags like <listen ...> (Tag for speech recognizer configuration, recognition execution, and post-processing) and <dtmf ...> (Dual Tone Multi Frequency tag for configuration and control of DTMF collection, and recording) much easily. SALT FAQs are a good resource.
There is a good comprehensive statement regarding SALT and SVG on the SALT Forum's Web site:
"As SVG excels at visual rendering, SALT excels at providing rich and lightweight support for speech interactions. At the core of SALT are two objects: a 'listen' object that provides all the functionality for speech input, and a 'prompt' object, speech output. The speech input object can record or convert the user's utterance into the corresponding text transcription, whereas the speech output object can play pre-recorded waveforms or synthesize speech from text."
Conclusion
This article is just the tip of th iceberg; SVG holds much more. Its dynamic capabilities can be used in various other aspects and can be utilized for a wide variety of applications. My memories of SVG go back to '96, during my graduate days. I was assisting a junior group working on developing an SVG viewer for a compiler construction course. It must be the beauty of automation that attracted me, but I still remember the magic of interpreting CFG (context free grammar) lexicons and command line displays in our traditional C++ app; this was before SVG became a W3C standard. Further development is going on. Recent articles from Keith Bugg in DDJ and Christian Graus in Windows Developers Journal June 2002 Issue Rendering Graphics with SVG are quite good reads and depict current advances and potentials in SVG development.
I'll conclude that SVG is an excellent and easy way to implement pictures around contemporary dynamic drawing methods. It has several advantages over other technologies for dynamic data handling from the server or peers, and I hope you have enjoyed the article.
Cheers!
Further Readings
http://www.ddj.com/documents/s=2648/nam1012432043/index.html Corel Software Get Smart on XML
WDVL SVG Resources http://www.dbxgeomatics.com/SVGMapMakerSamples.asp?Language=
SVG Tutorial
http://www.w3.org/2002/Talks/www2002-svgtut-ih/hwtut.pdf
Scalable Vector Graphics: The What and the How
SVG's Past and Promising Future
http://www.xml.com/pub/a/2002/12/04/svg.html
SVG 1.2 W3C Draft
http://www.w3.org/TR/2002/WD-SVG12-20021115/
SVG Tips and Tricks: Adobe's SVG Viewer
http://www.xml.com/pub/a/2002/07/03/adobesvg.html
Adobe SVG viewer
http://www.adobe.com/svg/viewer/install/
SVG Graphics Overview
http://www.w3.org/Graphics/SVG/Overview.htm8
SVG Concepts
http://www.w3.org/TR/SVG/concepts.html
SVG Implementations
http://www.w3.org/Graphics/SVG/SVG-Implementations.htm8
W3C SVG Transformation Tool
http://www.w3.org/2002/05/svg2stuff.html
Server Side SVG - Mime Types
http://www.protocol7.com/svg-wiki/ow.asp?p=ServerSideSvg&revision=31
http://news.com.com/2100-1025_3-999120.html
Mobile SVG Profiles
http://www.w3.org/TR/2003/REC-SVGMobile-20030114/
This document defines two mobile profiles of SVG 1.1. The first profile, SVG Tiny, is defined to be suitable for cellphones; the second profile, SVG Basic, is suitable for PDAs.
Elliptical Arcs in SVG
http://www.protocol7.com/svg-wiki/ow.asp?ThePath
London Underground Web Site
Scalable Vector Graphics (SVG): An Executive Summary
http://wwws.sun.com/software/xml/developers/svg/
Adobe SVG website
http://www.adobe.com/svg
http://wdvl.com/Authoring/Languages/XML/SVG/
Generating SVG with JSP
http://wwws.sun.com/software/xml/developers/svg/jsp/
SVG Samples
Appendix A: MIME Type Detection in Internet Explorer
http://msdn.microsoft.com/library/default.asp?url=/workshop/networking/moniker/overview/appendix_a.asp
About the Author
Adnan Masood is a software developer for UKIM in London and is getting his Msc in software engineering from UNW Stratford London campus. With a broad hybrid development vision on multiple software development technologies, Adnan's main expertise is in server-side programming on Microsoft and Sun Platforms. He's been an active ASP and Java developer for the past five years and holds a Bachelors of Science degree in Computer Science and a Sun Java-II Certification (SCJP-II). He can be reached
via e-mail at adnanmasood@btconnect.com.