

SharePoint 2007: Integrating the Google Chart API
By Gatika
Patel – Kiefer Consulting
Introduction
When I work with users and business managers, there’s one
thing they always appreciate: time-saving
features, especially those with graphics. My users love them and yours will too.
By viewing current graphic data displays, users can instantly see if things are
going well or not without waiting for reports or evaluating and crunching
numbers manually. In case you did not know, the
Google Chart API lets you dynamically
generate charts in SharePoint. That’s right-DYNAMICALLY!
It’s easy to integrate Google Chart using SharePoint List data. All you
need is graph criteria. In this case, I use a
Group By view on a list column.
In this article, I’ll show you how to use Google Chart
API in SharePoint 2007 (MOSS):
1.
Create a Custom List in SharePoint Server 2007
2.
Create a Web Part page (used to display graphical
representation of the list data)
3.
Integrate Google Chart API into SharePoint
Create a Custom List in MOSS 2007
Follow the steps below in order to create a new custom
list.
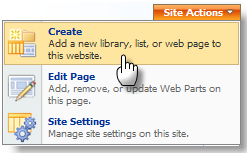
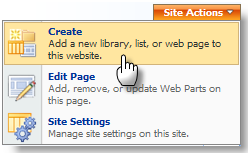
1.
Click Site
Actions > Create.
2.
Under Custom Lists, select
Custom List.

3.
Fill in
Name and Description.
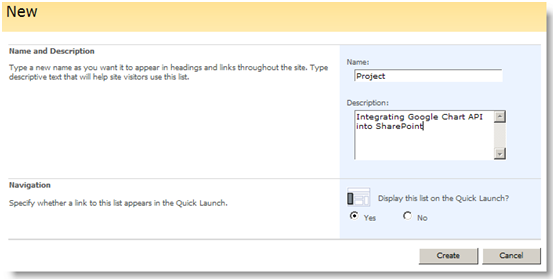
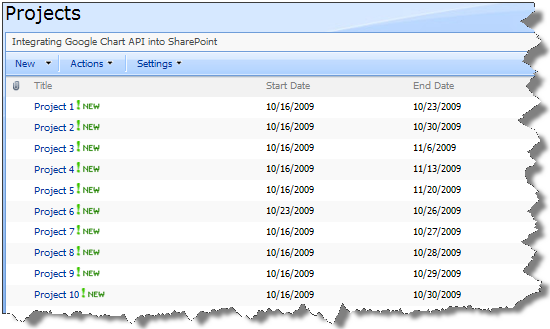
For this demonstration, name the list
Projects.
4.
Click
Create.
The Projects
custom list is created.

5.
Click
Settings > Create Column.
Enter the name of the new column, select the data
type, and details for each column you create.
For this demonstration, I created three new columns
in Projects:
–>
Start Date(Date)
–>
End Date (Date)
–>
Status (Choice list: Complete, Deferred, In
Progress, Not Started)
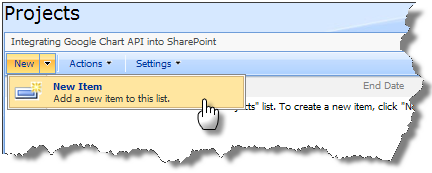
6.
Fill this list with sample data to create the
Google Chart.
To create sample data, click New.
7.
Fill the
New Item form, and click OK.
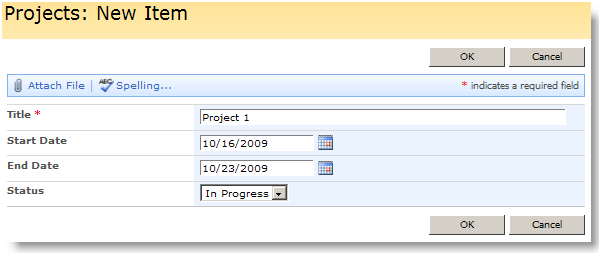
8.
Repeat until you have enough data to demonstrate
your Google Chart API.
For this example, I created 10 items.
Create a Web Part Page
Use the web part page used to display graphical
representation of the list data:
1.
Click Site
Actions > Create.
2.
Under the Web Pages section, select
Web Part Page.

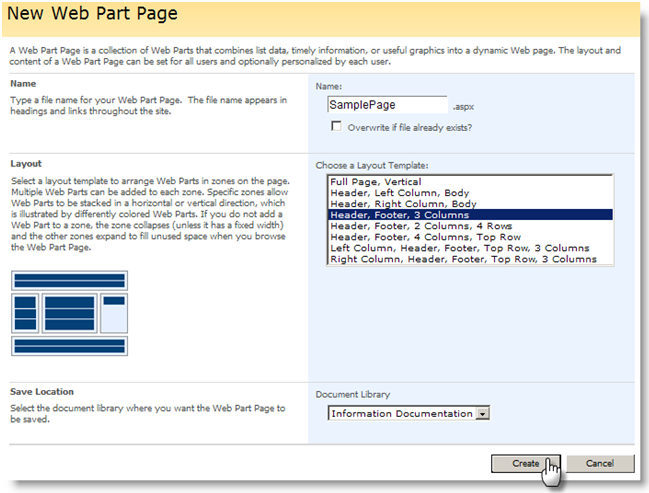
3.
Fill the required information for the
New Web Part Page:
–>
Name:
SamplePage
–>
Accept defaults
4.
Click
Create.
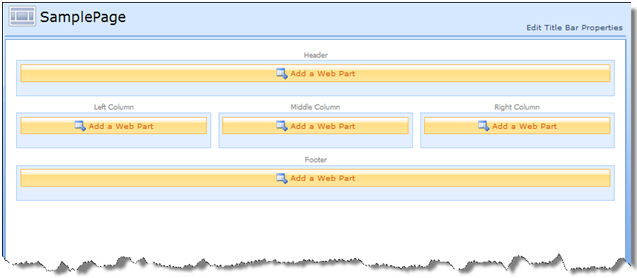
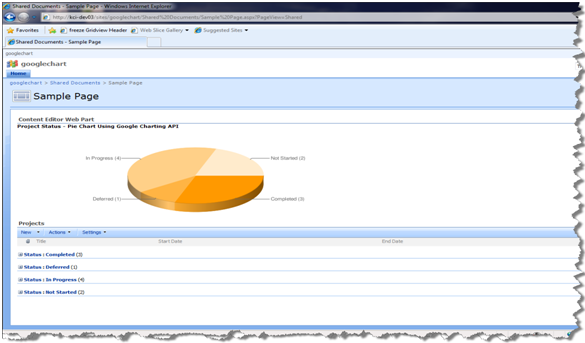
The new Sample
Page is created as below.
Integrate Google Chart API Into SharePoint
To display the graphical representation of any list data,
we first need to decide which column of the list we want to use as a graph
criteria. Then we need to create a “grouped by” list view on that column. For
chart to be displayed, the “grouped by” list view must be on the same page.
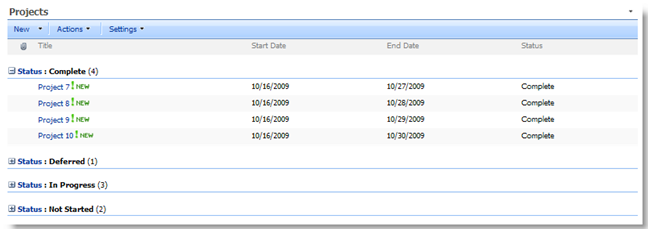
I use Status
as the criteria for the graph. We first need to add the
Projects list web part on the Sample Page to display Projects list
“group by” Status column.
1.
Click Add
a Web Part in any of the zone of the page.
2.
Under the
Lists and Libraries section, select the
Projects list (or the name of your
list).
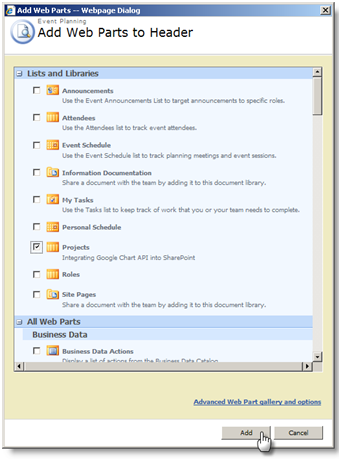
3.
Click Add.
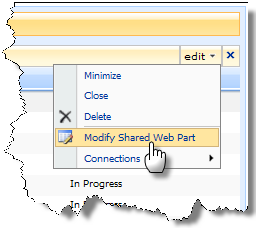
We need to edit this list to create a new view
grouped by the Status column.
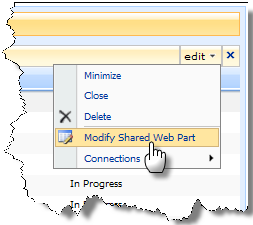
4.
Click Edit
> Modify Shared Web Part.
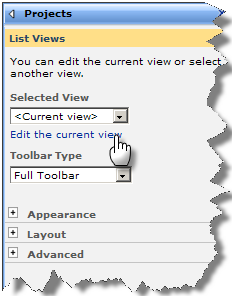
5.
Click Edit
the current view link.
6.
Scroll to the bottom of the page, and click to
expand Group By section.
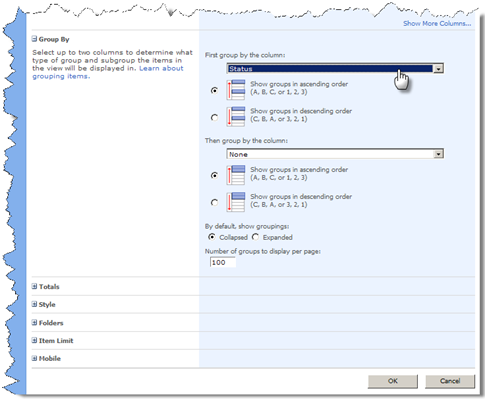
7.
For First
group by the column: select the
Status column.
8.
Select your preference for
Ascending or Descending order.
9.
Click OK.
The newly created list view will be added on the
Sample Page.
Now to add graph for the list view, we need to add
another web part on the Sample Page: Content Editor Web Part
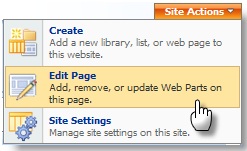
10.
Click Site
Actions > Edit Page.
11.
Click Add
a Web Part above the Project list
view just added.

12.
Under the
Miscellaneous section, select Content
Editor Web Part.
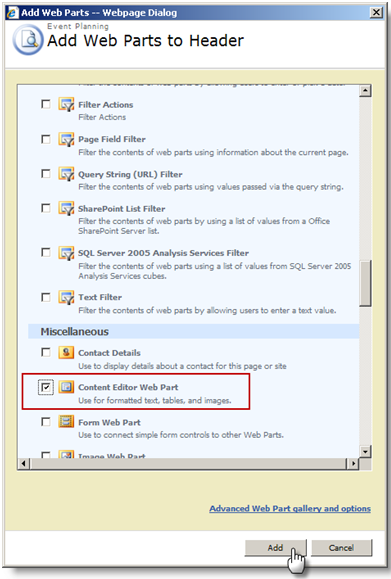
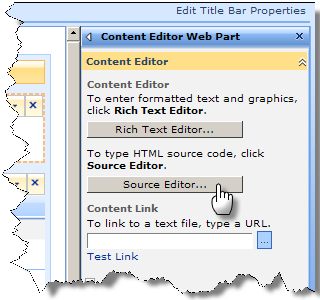
13.
click Add.
14.
Select
Edit > Modify Shared Web Part.
15.
Open the Source Editor (right side).
16.
Copy the following code
and paste into the
Text Entry dialog box:
<div id="jLoadMe"
class="content"><strong>Project Status – Pie Chart Using Google Charting
API</strong></div>
<script type="text/javascript">if(typeof
jQuery=="undefined"){
var jQPath="http://ajax.googleapis.com/ajax/libs/jquery/1.3.2/";
document.write("<script src='",jQPath,"jquery.js' type='text/javascript'><\/script>");}
</script>
<script type="text/javascript">
$("document").ready(function(){
var arrayList=$("td.ms-gb:contains(':')");
var coord= new Array();
var labels= new Array();
$.each(arrayList, function(i,e)
{
var MyIf= $(e).text();
var txt= MyIf.substring(MyIf.indexOf('(')+1,MyIf.length-1); //
Extract the 'Y' coordinates
coord[i]=txt;
var txt1= MyIf.substring(MyIf.indexOf(':')+2,MyIf.indexOf("(")-1); //
Extract the labels
labels[i]=txt1+"("+txt+")";
//add also coordinates for better read
});
var txt= coord.join(",");
var txt1= labels.join("|");
// Adjust Chart Properties below – See Google Charts API for
reference
var vinc= "<IMG src='http://chart.apis.google.com/chart?cht=p3&chs=750×200&chd=t:"+txt+"&chl="+txt1+"'/>";
$("#jLoadMe").append("<p>"+vinc+"</p>")
});</script>
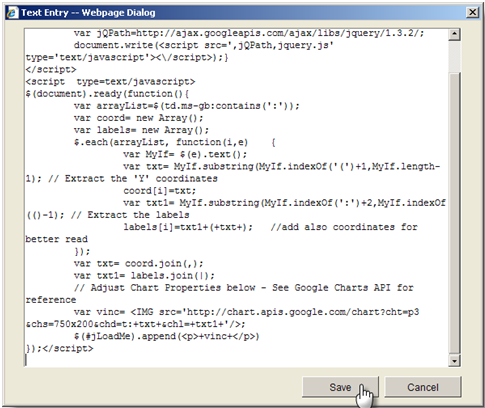
17.
Click Save.
You will see that the graph has been added into the
web part.
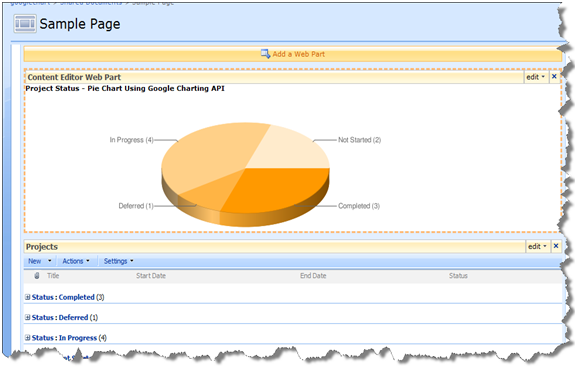
18.
Click OK.
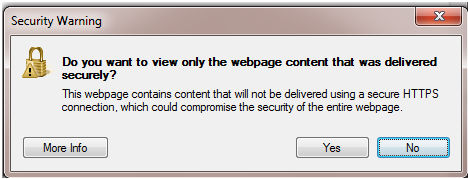
If you see the Security Warning box as below, click
No.
19.
Click Exit
Edit Mode.
|
|
|
With the help of Google Chart API and JavaScript, you can
very easily display a graphic representation of your list data. Happy coding!
Email me if you have any questions: gpatel@kieferconsulting.com.
Gatika Patel
is a Software Developer at Kiefer Consulting. She specializes in .NET and
SharePoint application development, software testing, database management, and
architecture planning. She is a Microsoft Certified Profession Developer who
earned her M.S. in Software Engineering from San Jose State University in
December 2008 and her Bachelor's degree in Information Technology from the Nirma
Institute of Technology in India. Her current consulting assignments include
various large projects for the State of California.
Kiefer Consulting, Inc.
is the leader in California State Government SharePoint deployments, providing
real business solutions using Microsoft .NET technologies. With a 22 year track
record of business success, the firm has experience ranging from the first .NET
releases all the way to legacy mainframe systems. Kiefer consultants are experts
in the technologies they deploy, so clients always get best value solutions that
balance Industry Best Practices and new technologies.
Register now for Kiefer’s 2010
events and Edunarsb :
www.kieferconsulting.com