

Introduction
When you are building a new product, there is no dearth of features that need to be built and bugs that need to be fixed. How do developers then decide what to prioritize? One of the features being offered as part of Visual Studio Online is Application Insights, a new service that can collect rich operational, performance, and customer usage information from the server and client application wherever they run.
This information can provide a complete insight into the availability and performance of your service, and help identify the root cause and support a rich diagnostic experience. You also can get information to continually improve your application and prioritize new features.
Application Insights offers the following features:
Monitoring
Developers can create a realistic simulation of user interactions with your service and use them to monitor your application from around the world. You also can get an idea of application performance and be alerted whenever the application does not respond according to the established thresholds
Performance & Usage
Developers can get advanced diagnostic performance functionality directly within the Visual Studio IDE. By looking at live data, you can identify patterns of user behavior and build your service and infrastructure to handle user requests.
Reporting
Application Insights also provides a rich dashboard that provides pre-configured insights. You then can configure a view that is unique to your application.
Hands On
To use Application Insights with VS Online, go to your dashboard, find the link to Application Insights, and click it.
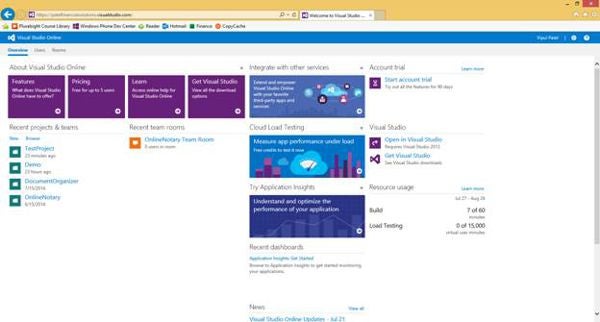
Figure 1: Finding the link to Application Insights
You will be taken to a page to sign up for Application Insights.
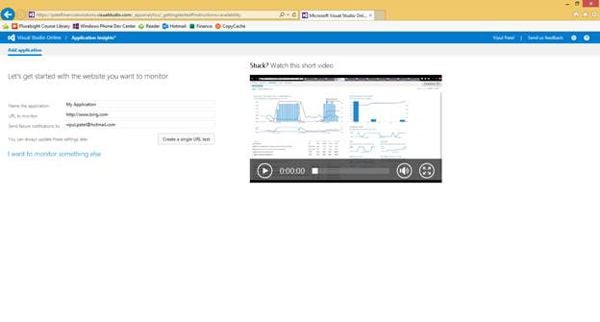
Figure 2: Signing up for Application Insights
Select the URL you would like to monitor and click “Create a single URL test”. For the purpose of the demo, I will leave the default URL to bing.com and proceed.
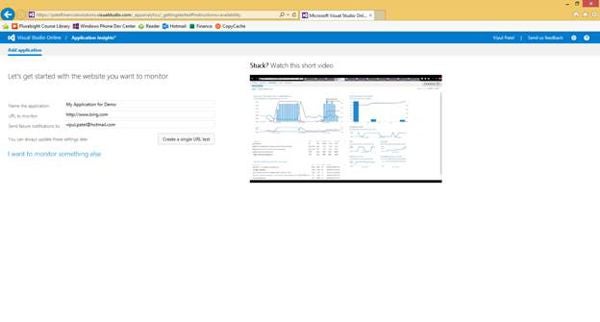
Figure 3: Leaving the default URL
You then will be taken to the preconfigured dashboard that Application Insights provides. The dashboard looks like the one shown in Figure 4.
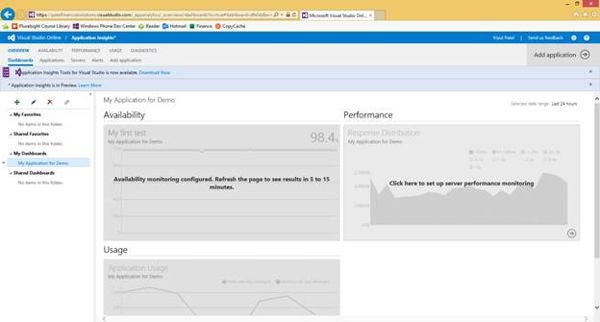
Figure 4: The preconfigured dashboard that Application Insights provides
To customize the dashboard, we can create a new dashboard by clicking the “+” link on the left tab.
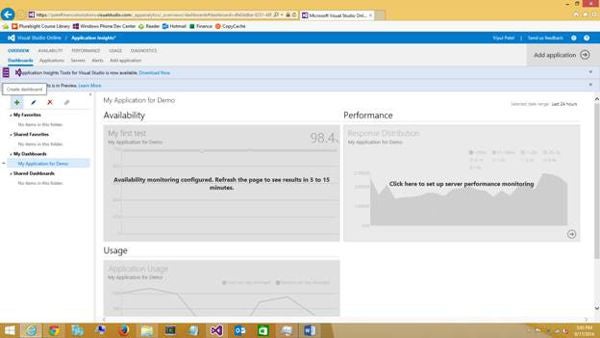
Figure 5: Creating a new dashboard
Now, let us explore the various aspects of the Application Insights. If you navigate to the Applications link, you can see the availability information for the application.
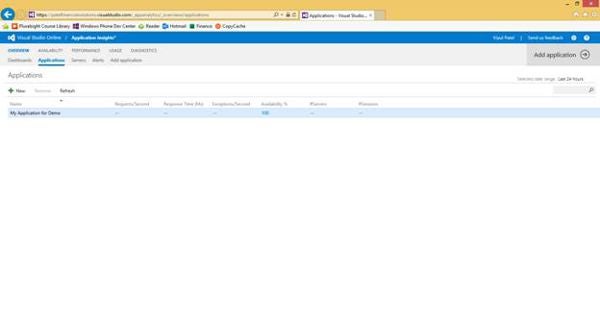
Figure 6: The availability information for the application
You can add more applications to analyze by clicking the “+” link. Doing so will prompt you for more information, as shown in Figure 7.
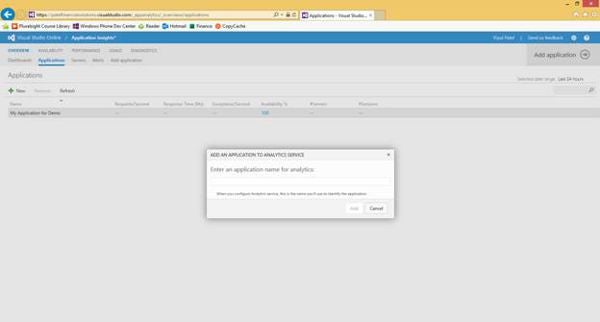
Figure 7: Adding more applications to analyze
Next, navigate to the “Alerts” link to see the default alerts configured.
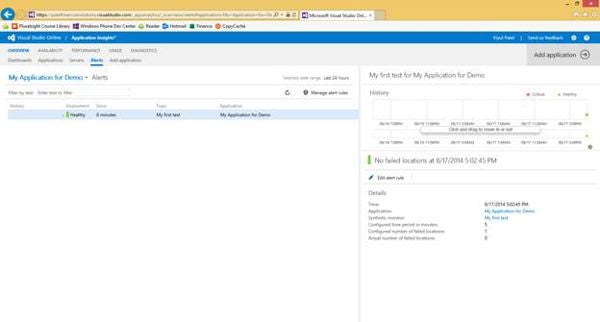
Figure 8: Navigating to the “Alerts” link
To manage alert rules, click the “Manage alert rules” link. This will take you to a window that shows currently configured alerts.
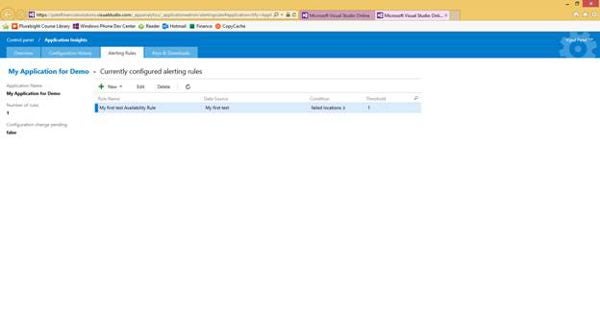
Figure 9: The window that shows currently configured alerts
Select an alert rule and click Edit to change the alert. You can delete an alert by selecting an alert and clicking Delete. To add an application to monitor, you can click the “Add application” link.
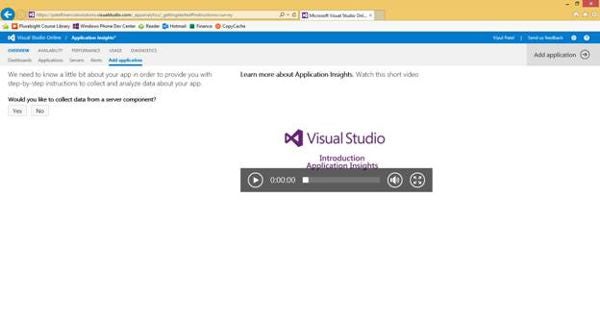
Figure 10: Clicking the “Add application” link
You will be prompted whether you want to collect data from a server or a client component. For server components, both .NET and Java frameworks are supported; for .NET applications, you can monitor either performance or usage.
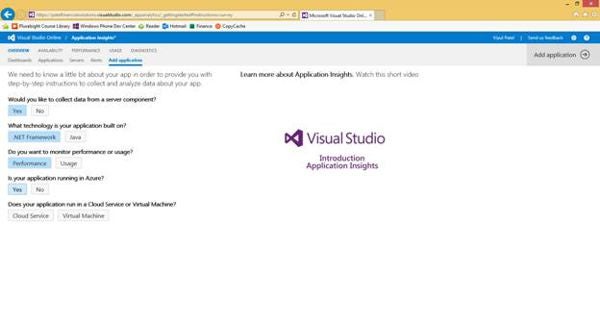
Figure 11: Monitoring either performance or usage
For client applications, you can choose among a website, Windows Phone 8 application, or a Windows Store application.
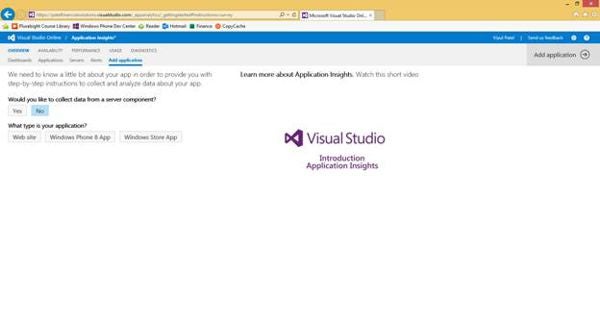
Figure 12: Choosing an application
Once you make your choice, you will be provided instructions on how to configure your application.
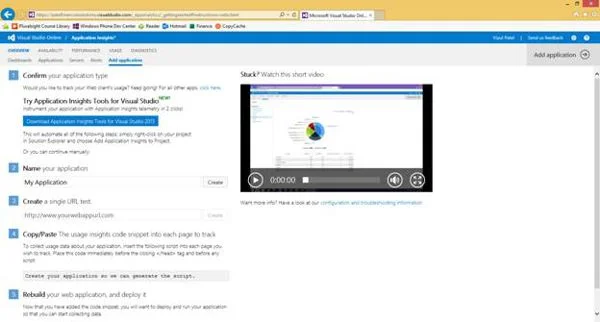
Figure 13: Viewing the configuration instructions
Performance Monitoring
To set up performance monitoring, navigate to the “Performance” link and follow the steps shown in Figure 14.
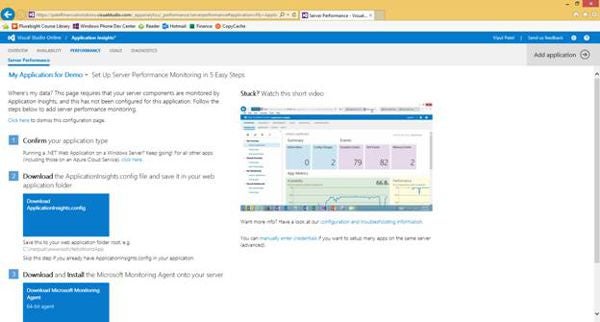
Figure 14: Navigating to the “Performance” link
For a .NET web application running on Windows Server, you will be asked to download a config file and install the Microsoft Monitoring Agent on your server.
Summary
In this article, we learned the basics about Application Insights and how to use them in Visual Studio Online applications. I hope you have found this information useful.
About the Author
Vipul Patel is technology geek based in Seattle. He can be reached at [email protected]. You can visit his LinkedIn profile at https://www.linkedin.com/pub/vipul-patel/6/675/508.