

Introduction
provides a rich debugging experience to developers, helping them write robust
and bug free code. In simple projects, the inbuilt facilities of Visual Studio
debugger may be sufficient for your purpose, however, while debugging complex
projects you may want to enhance the debugging experience further. Luckily,
Visual Studio offers debugger attributes that help you do just that. Debugger
attributes allow you to customize the way Visual Studio debugger steps through
your code and also the display of your types. This article explains some of the
important debugger attributes along with debugger type proxies and visualizers.
Debugger Attributes at a Glance
Most of the debugger attributes are found in System.Diagnostics namespace.
In this article, you will learn to use the following debugger attributes:
- DebuggerDisplay:
This attribute allows you to display a custom piece of information about a
type, such as Watch Window, Quick Watch Window and Data Tips, in the debugger
variable windows.
- DebuggerBrowsable:
This attribute specifies how a class member is displayed in the debugger
variable windows. You can also hide a member from appearing in the
debugger variable windows.
- DebuggerHidden:
This attribute tells the Visual Studio debugger to step over the code
instead of stepping into the code.
- DebuggerStepThrough:
This attribute tells the Visual Studio debugger to step over the code
instead of stepping into the code but treats that code as external in the
call stack.
- DebuggerTypeProxy:
For complex classes you may want to customize their appearance in the
debugger variable windows. This attribute specifies a proxy type to be
used for such customized display.
- DebuggerVisualizer: You may want to view
an object of your type in a special viewer rather than inbuilt debugger
variable windows. This attribute helps you to link a custom viewer with
your class.
Let’s examine how each on the above attributes works with an example. In
order to work with the examples that follow, you need to create a new Console
Application in C# and import System.Diagnostics namespace at the top of the
default class file.
DebuggerDisplay Attribute
Assume that you have a simple class as shown below:
class Program
{
  public List<string> Fruits = new List<string>();
  ...
  static void Main(string[] args)
  {
    Program p = new Program();
    p.Fruits.Add("Apple");
    p.Fruits.Add("Mango");
    p.Fruits.Add("Banana");
    ...
  }
}
Now, if you run the application and observe the Program class in Visual
Studio Watch window or simply hover your mouse over the object p, you will see
something like this:
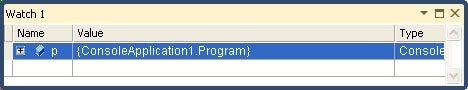
Figure 1: Visual Studio Watch window
Notice the Value column. It displays the fully qualified name of the class
under consideration. Many times, however, you are already familiar with this
piece of information and displaying it in debugger variable windows doesn’t
serve any useful purpose. It would be handy if we can see some useful
information about the class instead of its fully qualified name. The
[DebuggerDisplay] attribute allows you to do just that. Using the
[DebuggerDisplay] attribute you can specify custom information that will appear
in the debugger variable windows. The following fragment of code illustrates
how the [DebuggerDisplay] attribute can be used on the Program class.
[DebuggerDisplay("There are {Fruits.Count} delicious fruits!")]
class Program
{
  ...
}
Notice how Fruits.Count is used in the curly brackets ({…}) to output the
total number of items in the list of Fruits. The following figure shows the
same variable p after applying [DebuggerDisplay] attribute.
![The variable p after applying [DebuggerDisplay] attribute](https://assets.codeguru.com/uploads/2021/07/DebuggerAttributes_image002.jpg)
Figure 2: The variable p after applying [DebuggerDisplay] attribute
See how the fully qualified type name is replaced with the information from
[DebuggerDisplay] attribute.
DebuggerBrowsable Attribute
The [DebuggerBrowsable] attribute specifies how to display a field in
debugger variable windows. It also allows you to hide a field. Consider the
following piece of code:
[DebuggerDisplay("There are {Fruits.Count} delicious fruits!")]
class Program
{
    private List<string> lstFruits = new List<string>();

    public List<string> Fruits
    {
        get
        {
            return lstFruits;
        }
        set
        {
            lstFruits = value;
        }
    }
}
The above fragment of code modifies the Program class to have a property
named Fruits. The Fruits property wraps lstFruits variable. If you observe an
instance of Program class in Watch window it will appear as follows:
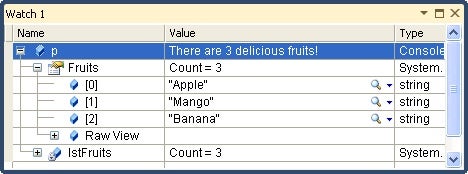
Figure 3: Program class in Watch window
As you can see in the above figure, the same list of fruits appears twice –
once as a Fruits property and then as a lstFruits variable. This duplication is
unnecessary. You can safely hide the lstFruits variable because the Fruits
property is displaying the same information. Now, have a look at the following
code that makes use of [DebuggerBrowsable] attribute to achieve that :
[DebuggerDisplay("There are {Fruits.Count} delicious fruits!")]
class Program
{
     [DebuggerBrowsable(DebuggerBrowsableState.Never)]
    private List<string> lstFruits = new List<string>();

    [DebuggerBrowsable(DebuggerBrowsableState.RootHidden)]
    public List<string> Fruits
    {
        get
        {
            return lstFruits;
        }
        set
        {
            lstFruits = value;
        }
    }
}
The [DebuggerBrowsable] applied on the lstFruits variable specifies that the
variable should never be displayed in the debugger variable windows. Similarly,
the [DebuggerBrowsable] attribute applied to the Fruits property specifies that
only the list items should be displayed in the debugger variable windows. The
DebuggerBrowsableState enumeration has three values – Never, Collapsed and
RootHidden. The following figure shows the effect of [DebuggerBrowsable]
attribute.
![The Effect of [DebuggerBrowsable] attribute](https://assets.codeguru.com/uploads/2021/07/DebuggerAttributes_image004.jpg)
Figure 4: The Effect of [DebuggerBrowsable] attribute
See how the lstFruits variable has disappeared from the Watch window. Also,
observe how individual items from the Fruits list appear directly under p
because of the DebuggerBrowsableState.RootHidden value.
DebuggerHidden Attribute
Sometimes you may not want to step into certain pieces of code. Consider,
for example, that you have a method that in turn calls a few other auxiliary
methods for the sake of tracing and logging. Now there is no need to step into
these auxiliary methods every time you debug the main method. In such cases the
auxiliary methods can be marked with the [DebuggerHidden] attribute. After
applying the [DebuggerHidden] attribute, debugger will always step over these
methods even if they have breakpoints. The Call Stack window won’t show the
methods decorated with [DebuggerHidden] attribute. Have a look at the
following code that illustrates the use of the [DebuggerHidden] attribute.
static void Main(string[] args)
{
    Program p = new Program();
    p.Fruits.Add("Apple");
    p.Fruits.Add("Mango");
    p.Fruits.Add("Banana");

    p.DisplayFruits();

    Console.ReadLine();
}

[DebuggerHidden]
public void DisplayFruits()
{
    foreach (string s in Fruits)
    {
        Console.WriteLine(s);
    }
    HelloWorld();
}

public void HelloWorld()
{
    Console.WriteLine("Hello World!");
}
The Main() method calls the DisplayFruits() method that is decorated with
the [DebuggerHidden] attribute. DisplayFruits() method in turn calls the
HelloWorld() method. Before you run the above code, set breakpoints at the
lines marked in bold. If you run the above code and keep pressing F11 (step
into) you will observe that the debugger won’t enter the DisplayFruits() method
at all and the Call Stack window will resemble the image shown below:
Figure 5: The Call Stack window
As you can see, the call stack doesn’t show the DisplayFruits() method but
the output as seen in the console window will prove that it has been executed.
DebuggerStepThrough Attribute
The [DebuggerStepThrough] attribute is similar to the [DebuggerHidden]
attribute in that it steps over the code but it marks the code as ‘External’ in
the call stack window. Consider the following piece of code:
static void Main(string[] args)
{
    Program p = new Program();
    p.Fruits.Add("Apple");
    p.Fruits.Add("Mango");
    p.Fruits.Add("Banana");

    p.DisplayFruits2();

    Console.ReadLine();
}

[DebuggerStepThrough]
public void DisplayFruits2()
{
    foreach (string s in Fruits)
    {
        Console.WriteLine(s);
    }
    HelloWorld();
}

public void HelloWorld()
{
    Console.WriteLine("Hello World!");
}
Notice that the DisplayFruits2() method is now marked with the
[DebuggerStepThrough] attribute. If you debug the application by pressing F11
the behavior will be similar to the previous example but the call stack window
shows DisplayFruits2() method as ‘External Code’.
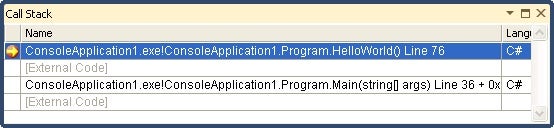
Figure 6: The Call Stack window shows the method as external code
DebuggerTypeProxy Attribute
By default the Visual Studio debugger will show all of the members of a type
as-is i.e. the way they appear in the actual type. However, if a type is
complicated in nature this behavior can be troublesome. In such cases you may
want to alter the ‘view’ of a type so that it exposes information the way you
want during the debugging process. That is where Type Proxies come into the
picture. Consider a class named User as shown below:
public class User
{
    public string UserId { get; set; }
    public string FirstName { get; set; }
    public string LastName { get; set; }
    public string Email { get; set; }
    public string Password { get; set; }
    public string Profile { get; set; }
}
The User class has six properties viz. UserId, FirstName, LastName, Email,
Password and Profile. In the Main() method you are using this class like this:
User obj = new User();
obj.UserId = "User1";
obj.FirstName = "Tom";
obj.LastName = "Jerry";
obj.Email = "[email protected]";

byte[] b = ASCIIEncoding.ASCII.GetBytes("password");
string str = Convert.ToBase64String(b);

obj.Password = str;
obj.Profile = "Hello world!";
You first create an instance of the User class and then assign various
property values. Notice how the Password property is being set. For the sake of
security the password is being encrypted (the above code uses Base64 encoding,
which is not secure as such. In real world cases you have some sound encryption
logic in place. Using Base64 encoding illustrates our point though.) and then
the encrypted value is assigned to the Password property. If you add a watch to
variable obj you will see something like this:
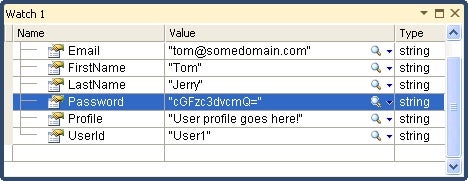
Figure 7: Add a Watch to variable obj
See how Password is being shown in Base64 encoding. During debugging you may
want to see the actual password rather than its Base64 representation.
Similarly, rather than viewing FirstName and LastName as two separate pieces
you may want to see the full name and may want to ignore the Profile property.
To accomplish such customization you need to create a Type Proxy and then
attach a type proxy to the User class using [DebuggerTypeProxy] attribute.
Let’s see how.
Create a new class named UserProxy as shown below:
public class UserProxy
{
    public string UserId { get; set; }
    public string DisplayName { get; set; }
    public string Email { get; set; }
    public string Password { get; set; }

    public UserProxy(User u)
    {
        this.UserId = u.UserId;
        this.DisplayName = u.FirstName + " " + u.LastName;
        this.Email = u.Email;
        this.Password = GetPlainPassword(u.Password);
    }

    private string GetPlainPassword(string pwd)
    {
        byte[] b = Convert.FromBase64String(pwd);
        string str = ASCIIEncoding.ASCII.GetString(b);
        return str;
    }
}
The UserProxy class defines four properties viz. UserId, DisplayName, Email
and Password. The constructor of UserProxy class takes a parameter of type
User. Inside the constructor various property values are assigned. Notice that
DisplayName is a combination of FirstName and LastName. The password in Base64
format is first decoded (using GetPlainPassword() method) and its plain string
value is assigned to the Password property.
To specify that the UserProxy class will act as a type proxy for the User
class, mark the User class with the [DebuggerTypeProxy] attribute as shown
below:
[DebuggerTypeProxy(typeof(UserProxy))]
public class User
{
   ...
}
If you now debug the code you will find that even though you are viewing the
object of the User class, it shows information based on the UserProxy class in
the Watch window.
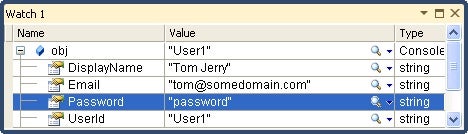
Figure 8: Information based on the UserProxy Class
Notice how DisplayName and Password properties re-arrange the information
from the User object.
DebuggerVisualizer Attribute
Visual Studio debugger variable windows provide a good view of information
for primitive types and classes. However, at times it becomes difficult to read
properties and variable values. For example, consider the User class discussed
earlier. The Profile property of the User class holds a free form string data
and it is tedious to view it in debugger variable windows. Similar situations
can arise for types such as DataSets, DataTables and complex types. Luckily,
Visual Studio allows you to define your own dialog for displaying a type
information. Such a dialog is referred as a Visualizer. There are some inbuilt
visualizers too as shown below:
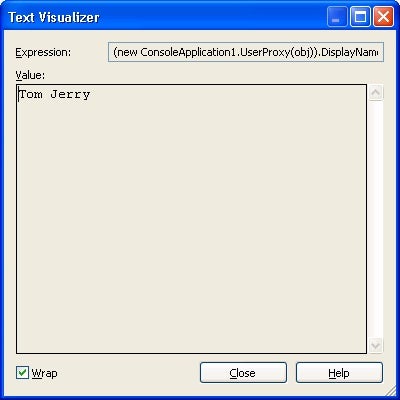
Figure 9: Text Visualizer
Visualizers are displayed when you click on the magnifying glass icon in any
of the debugger variable windows (see below).
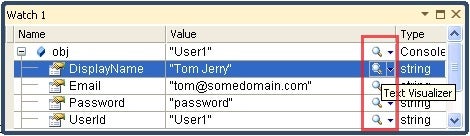
Figure 10: Click the magnifying glass icon to display the Visualizer
In order to create a custom visualizer first you need to create a Windows
Forms based dialog that acts as the visualizer. You then need to create a
visualizer class inheriting from the DialogDebuggerVisualizer base class.
Finally, you need to mark a type with the [DebuggerVisualizer] attribute.
To create a custom visualizer for the User class, add a Windows Form to the
project and design it as shown below:
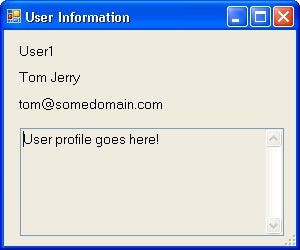
Figure 11: Create a custom visualizer
As you can see the above form displays user information in various Label
controls. The constructor of the Form has the following code:
public ProfileVisualizer(User usr)
{
    InitializeComponent();
    label1.Text = usr.UserId;
    label2.Text = usr.FirstName + " " + usr.LastName;
    label3.Text = usr.Email;
    textBox1.Text = usr.Profile;
}
The constructor accepts a User instance and then assigns property values to
Label controls.
Next, add a reference to Microsoft.VisualStudio.DebuggerVisualizers
assembly. To locate this assembly, use the Browse tab of Add Reference dialog
and navigate to <Installation folder for VS
2010>\Common7\IDE\ReferenceAssemblies\v2.0.
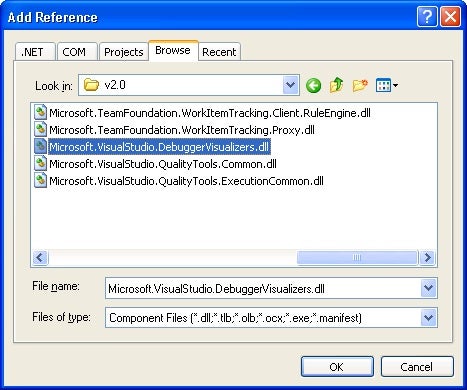
Figure 12: Add a reference to Microsoft.VisualStudio.DebuggerVisualizers assembly
Next, create a new class named UserVisualizer and inherit it from
DialogDebuggerVisualizer class as shown below:
public class UserVisualizer : DialogDebuggerVisualizer
{

   protected override void Show(IDialogVisualizerService windowService, IVisualizerObjectProvider objectProvider)
   {
        User usr = (User)objectProvider.GetObject();
        MyVisualizer form = new MyVisualizer(usr);
        windowService.ShowDialog(form);
   }
}
The DialogDebuggerVisualizer resides in the Microsoft.VisualStudio.DebuggerVisualizers
namespace, so ensure that this namespace is imported at the top of the class
file. Once inherited you need to override the Show() method. The Show() method
creates an instance of the Windows Forms dialog you created earlier and then
invokes the ShowDialog() method on the windowService parameter.
The last step is to attach the custom visualizer class to the User class
with the help of [DebuggerVisualizer] attribute.
...
[DebuggerVisualizer(typeof(UserVisualizer))]
public class User
{
    ...
}
Now, if you debug the application and click on the magnifying glass icon
next to the User object (obj variable) you will see the custom visualizer
populated with data from the User instance under consideration.
Summary
Visual Studio debugger attributes allow you to customize and enhance your
debugging experience. This article discussed some of the useful debugger
attributes viz. DebuggerDisplay, DebuggerBrowsable, DebuggerHidden,
DebuggerStepThrough, DebuggerTypeProxy and DebuggerVisualizer. The
DebuggerDisplay attribute allows you to display a custom piece of information
about a type in the debugger variable windows. The DebuggerBrowsable attribute
specifies how a class member is displayed in the debugger variable windows. You
can also hide a member from appearing in the debugger variable windows. The
DebuggerHidden attribute tells the Visual Studio debugger to step over the code
instead of stepping into the code. The DebuggerStepThrough attribute tells the
Visual Studio debugger to step over the code instead of stepping into the code
but treats that code as external in the call stack. For complex classes you may
want to customize their appearance in the debugger variable windows. The
DebuggerTypeProxy attribute specifies a proxy type to be used for such
customized display. At times you may want to view an object of your type in a
special viewer rather than inbuilt debugger variable windows. The
DebuggerVisualizer attribute helps you to link a custom viewer with your class.