Mark Strawmyer Presents: .NET Nuts & Bolts
Welcome to the next installment of the .NET Nuts & Bolts column. This article covers performance counters and how to use them to your advantage within your applications. It starts by explaining why providing performance instrumentation is important and follows with some examples of setting up and using performance counters. It primarily involves using classes in the System.Diagnostics namespace.
Measuring Performance
Instrumentation often refers to measuring the performance of an application: the application’s ability to monitor and report on key performance indicators. These indicators help to determine the overall performance of an application and can also help diagnose those pesky “undocumented features” (a.k.a. errors or bugs). The following items typically comprise complete instrumentation:
- Debugging—This feature allows you to print out conditional debugging information that can be left in the code at all times and excluded automatically when compiling in release mode. This allows you to have complete debugging messages available to you during development and testing and not have to change code prior to production release. It is facilitated through the System.Diagnostics.Debug class.
- Tracing—This feature allows you to monitor the status of your application through conditional statements. Similar to debugging, it involves the use of output messages from the application to display state information. However, tracing statements are generally included in the production release of an application and are enabled when needed, where debug messages are generally excluded. It is facilitated through the System.Diagnostics.Trace class.
- Logging—This feature involves writing information on major events related to your application, such as errors. Common places to log information include the Windows Event Log, a file, or a database.
- Performance counters—These features can monitor physical system components such as processors, memory, and networks, and if used within your application, can capture and publish performance-related data about that application. The published counter information is captured and you can then compare it against acceptable performance criteria. Performance counters are available on modern versions of Microsoft operating systems, such as Windows 2000 and XP.
You can use any combination of the above items to complete instrumentation within your applications. However, this article focuses strictly on performance counters.
Basics of Performance Counters
Related performance counters are grouped into categories. Existing Microsoft Windows categories include Processor and Memory. The Processor category, for example, contains all of the counters related to measuring the performance of the system’s processor.
An instance is an optional further grouping of counters. Instances track data on multiple occurrences of an object the category represents. For example, a system with multiple processors would have an instance for each processor and another instance representing the total performance of all processors. That would enable you to monitor the performance behavior of any individual processor or all of them combined. Individual counters can be defined to measure whatever criteria you desire.
Performance Counter Types
A number of different performance counter types are available. They range from items that contain counts, to those that perform calculations such as averages. The following list contains a few of the more common ones that this article explores in its examples:
- AverageTimer32—a counter that measures the average time required to complete a process or operation. It is calculated by a ratio of total time elapsed to the number of items completed during that time.
- AverageBase—a supporting base counter that contains the number of items completed during the sample interval.
- NumberOfItems32—an instance counter that tracks a count of items. You can use it to monitor the number of times an operation is performed.
- RateOfCountsPerSecond32—a counter that tracks the number of items or operations per second.
The System.Diagnostics.PerformanceCounterType enumeration is a complete list of all of the different performance counter types available. A handful of counters are considered base counters, as indicated by “Base” appended to the end of the class name. The base counters are required, as they support other counters that perform calculations.
Creation and Setup of Performance Counters
Performance counters are fairly easy to set up during development and testing, but they can be tricky to set up and deploy in production.
Performance Counter Installation with Server Explorer
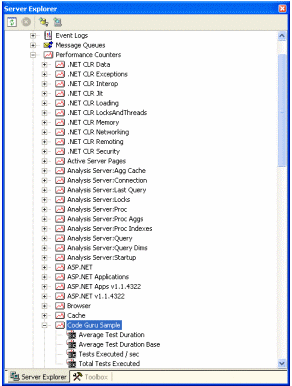
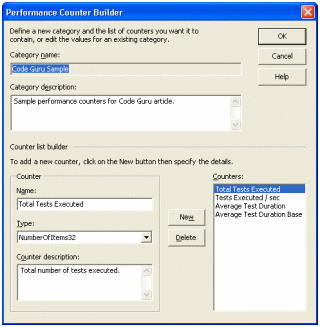
The simplest way to set up performance categories and counters is by using Server Explorer, which is an administrative component available in several editions of Visual Studio .NET. If you don’t see Server Explorer, go to the View menu and select the Server Explorer option. You can create new categories and as many counters for each category as you desire. Any base type you use must immediately follow the counter that it will support. The following screenshots show the Server Explorer (Figure 1) and the Performance Counter Builder (Figure 2) you use to create categories and counters within Visual Studio.

Figure 1—Server Explorer

Figure 2—Performance Counter Builder
Performance Counter Installation Sample Code
A user can programmatically create counters at run time, but the user first must have the proper administrative rights (which the ASP.NET user does not have by default). This means you must elevate the rights of the ASPNET account, use impersonation within your application, or create a setup package with install actions to set up the counters.
To programmatically create the counters, create an instance of System.Diagnostics.CounterCreationDataCollection to hold counter instances. Then, create instances of the System.Diagnostics.CounterCreationData class and add them to the collection. Once you’ve added all of the counters into the collection, use the System.Diagnostics.PerformanceCounterCategory.Create method to create the new category and all of the related counters stored in the collection. The following sample code programmatically creates the counters, assuming your user account has the necessary rights to do so:
// Set up the performance counter(s) if they don't already exist
if( !PerformanceCounterCategory.Exists("CodeGuru Sample") )
{
   // Create the collection container
   CounterCreationDataCollection counters = new
      CounterCreationDataCollection();

   // Create counter #1 and add it to the collection
   CounterCreationData tests = new CounterCreationData();
   tests.CounterName = "Total Tests Executed";
   tests.CounterHelp = "Total number of tests executed.";
   tests.CounterType = PerformanceCounterType.NumberOfItems32;
   counters.Add(tests);

   // Create counter #2 and add it to the collection
   CounterCreationData testsPerSec = new CounterCreationData();
   testsPerSec.CounterName = "Tests Executed / sec";
   testsPerSec.CounterHelp = "Number of tests executed per second.";
   testsPerSec.CounterType =
      PerformanceCounterType.RateOfCountsPerSecond32;
   counters.Add(testsPerSec);

   // Create counter #3 and add it to the collection
   CounterCreationData avgTest = new CounterCreationData();
   avgTest.CounterName = "Average Test Duration";
   avgTest.CounterHelp = "Average time to execute a test.";
   avgTest.CounterType = PerformanceCounterType.AverageTimer32;
   counters.Add(avgTest);

   // Create counter #4 and add it to the collection
   CounterCreationData avgTestBase = new CounterCreationData();
   avgTestBase.CounterName = "Average Test Duration Base";
   avgTestBase.CounterHelp = "Average time to execute a test base.";
   avgTestBase.CounterType = PerformanceCounterType.AverageBase;
   counters.Add(avgTestBase);

   // Create the category and all of the counters.
   PerformanceCounterCategory.Create("CodeGuru Sample",
      "Sample performance counters for CodeGuru article.",
      counters);
}
Use of Performance Counters
Now that you’ve created the counters, it’s time to use them programmatically.
Performance Counter Usage Sample Code
The following sample code demonstrates the programmatic use of performance counters. It contains a helper class to control the counters within a specific category:
using System;
using System.Diagnostics;

namespace CodeGuru.Instrumentation
{
   /// <summary>
   /// Helper class to demonstrate the setup of performance counters.
   /// </summary>
   public class PerformanceCounterHelper
{
   // Total number of tests executed
   private PerformanceCounter _TotalTests = null;
   // Total tests executed per second
   private PerformanceCounter _TestsPerSecond = null;
   // Average test duration
   private PerformanceCounter _AverageTest = null;
   // Average test duration base
   private PerformanceCounter _AverageTestBase = null;

   /// <summary>
   /// Constructor
   /// </summary>
   public PerformanceCounterHelper()
   {
   // Set up the performance counter(s)
   if( !PerformanceCounterCategory.Exists("CodeGuru Sample") )
   {
      // Create the collection container
      CounterCreationDataCollection counters = new
          CounterCreationDataCollection();

      // Create counter #1 and add it to the collection
      CounterCreationData tests = new CounterCreationData();
      tests.CounterName = "Total Tests Executed";
      tests.CounterHelp = "Total number of tests executed.";
      tests.CounterType = PerformanceCounterType.NumberOfItems32;
      counters.Add(tests);

      // Create counter #2 and add it to the collection
      CounterCreationData testsPerSec = new CounterCreationData();
      testsPerSec.CounterName = "Tests Executed / sec";
      testsPerSec.CounterHelp = "Number of tests executed per
                                 second.";
      testsPerSec.CounterType =
         PerformanceCounterType.RateOfCountsPerSecond32;
      counters.Add(testsPerSec);

      // Create counter #3 and add it to the collection
      CounterCreationData avgTest = new CounterCreationData();
      avgTest.CounterName = "Average Test Duration";
      avgTest.CounterHelp = "Average time to execute a test.";
      avgTest.CounterType = PerformanceCounterType.AverageTimer32;
      counters.Add(avgTest);

      // Create counter #4 and add it to the collection
      CounterCreationData avgTestBase = new CounterCreationData();
      avgTestBase.CounterName = "Average Test Duration Base";
      avgTestBase.CounterHelp = "Average time to execute a test
                                 base.";
      avgTestBase.CounterType = PerformanceCounterType.AverageBase;
      counters.Add(avgTestBase);

      // Create the category and all of the counters.
      PerformanceCounterCategory.Create("CodeGuru Sample",
         "Sample performance counters for CodeGuru article.",
         counters);
      }

      _TotalTests              = new PerformanceCounter();
      _TotalTests.CategoryName = "CodeGuru Sample";
      _TotalTests.CounterName  = "Total Tests Executed";
      _TotalTests.MachineName  = ".";
      _TotalTests.ReadOnly     = false;

      _TestsPerSecond              = new PerformanceCounter();
      _TestsPerSecond.CategoryName = "CodeGuru Sample";
      _TestsPerSecond.CounterName = "Tests Executed / sec";
      _TestsPerSecond.MachineName = ".";
      _TestsPerSecond.ReadOnly    = false;

      _AverageTest              = new PerformanceCounter();
      _AverageTest.CategoryName = "CodeGuru Sample";
      _AverageTest.CounterName  = "Average Test Duration";
      _AverageTest.MachineName  = ".";
      _AverageTest.ReadOnly     = false;

      _AverageTestBase              = new PerformanceCounter();
      _AverageTestBase.CategoryName = "CodeGuru Sample";
      _AverageTestBase.CounterName  = "Average Test Duration Base";
      _AverageTestBase.MachineName  = ".";
      _AverageTestBase.ReadOnly     = false;
      }

      /// <summary>
      /// Increment the CodeGuru sample counters.
      /// </summary>
      /// <param name="Ticks">Timing interval</param>
      public void IncrementCounters(long Ticks)
      {
         _TotalTests.Increment();
         _TestsPerSecond.Increment();
         _AverageTest.IncrementBy(Ticks);
         _AverageTestBase.Increment();
      }
   }
}
This code creates a Windows Forms application that features a single button to test the counters. By adding the following code to the _Click event buttons, you enable it to simulate some processing and update the counters along the way:
long startTime = 0;
PerformanceCounterHelper counterHelper = new
   PerformanceCounterHelper();
Random interval = new Random(500);

for( int i = 0; i < 300; i++ )
{
   startTime = DateTime.Now.Ticks;
   System.Threading.Thread.Sleep(interval.Next(500));
   counterHelper.IncrementCounters(DateTime.Now.Ticks - startTime);
}
Performance Counter Output
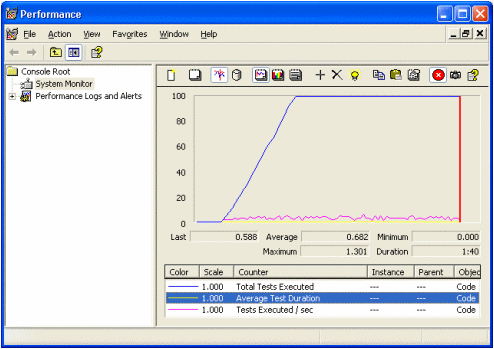
Figure 3 shows the output of executing the above sample code. The screenshot appears after opening the performance monitor, removing the default counters, and adding in the custom counters.

Figure 3—Screenshot of Performance Counter Output
Note that the sampling interval can influence how your counters behave. If you increment and decrement a counter prior to a sampling occurring, the increment action will have no bearing on the performance output.
Possible Enhancements
You have seen some of the basics of using performance counters, along with examples of the more commonly used types. Now, it is up to you to further explore the rest to the available performance counter types and how they may benefit your applications. You may find it helpful to create helper classes for each of the categories of performance counters you wish to create. This will allow you to centralize the use of performance counters and prevent you from duplicating code at each location where the counters will be utilized.
Future Columns
The topic of the next column is yet to be determined. If you have something in particular that you would like to see explained here, you can reach me at [email protected].

