

Introduction
Web developers frequently need to check the runtime HTML source being generated by their ASP.NET web forms and views. Visual Studio Page Inspector is a diagnostic tool that helps you to dissect and observe the HTML source and styling information of your web pages. The Page Inspector not only provides an integrated development experience but also presents detailed information about the page in easy to read form. This article shows you how the Page Inspector can be used with ASP.NET Web Forms.
Visual Studio 2012 Page Inspector
Visual Studio 2012 Page Inspector provides a diagnostic tool that integrates with Visual Studio IDE and provides you with the following pieces of information:
- Allows you to see how a piece of HTML markup looks in the browser
- Allows you to see the HTML source resulted from a piece of server side code or element or control on the form
- Shows you a list of files that make the current page (For example, User Control files)
- Allows you to see the CSS style information applied to an element
Using the page inspector you can debug and fix your HTML markup and CSS styles that are used in a web form. The page inspector can be invoked in two ways. You can load a web form in the page inspector by right clicking it in the Solution Explorer and then selecting View in Page Inspector menu item (see the figure below).
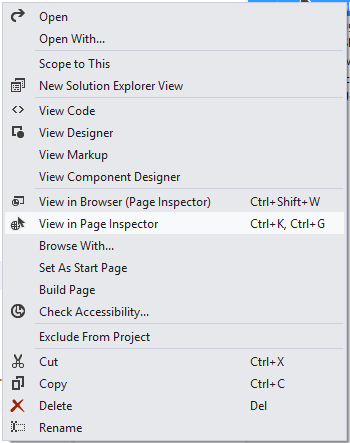
Right click in Solution Explorer and select View in Page Inspector
Alternatively, you can also run the web application in Page Inspector mode as shown below:
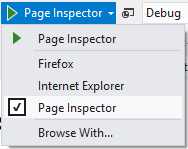
Run the web application in Page Inspector mode
Whatever method you use to load a web page into page inspector, it allows you to examine the above details about the page. The page inspector is integrated with the Visual Studio IDE and you can use it even when the web form is being designed in the web form designer.
To understand page inspector better let’s create a simple web form consisting of a GridView as shown below:
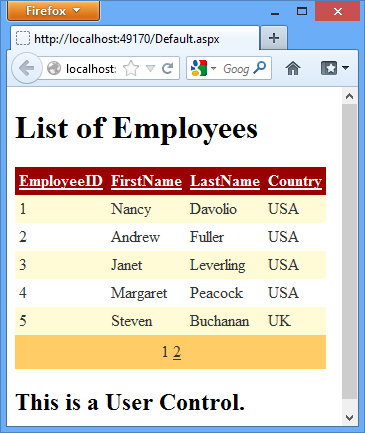
Create a simple web form
As you can see, the web form consists of a GridView control that displays records from the Employees table of the Northwind database. There is also a Web User Control below the GridView that simply outputs some text. Let’s inspect this web form in the page inspector and try to become familiar with various windows of the page inspector.
Page Inspector Browser
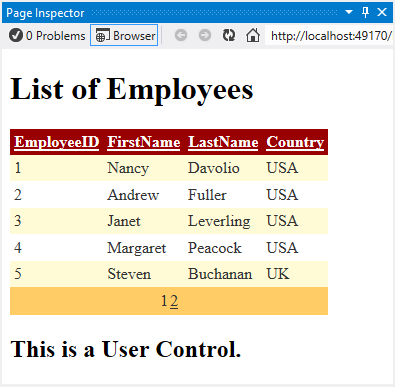
Page Inspector Browser
The page inspector browser essentially displays the web form as it would look in a browser window. That is, it executes all the server side code that would otherwise be executed when you request the web form via a browser. Remember that the page inspector browser is based on IE and you should not rely on this window to test browser specific client scripts for obvious reasons.
Viewing HTML Source
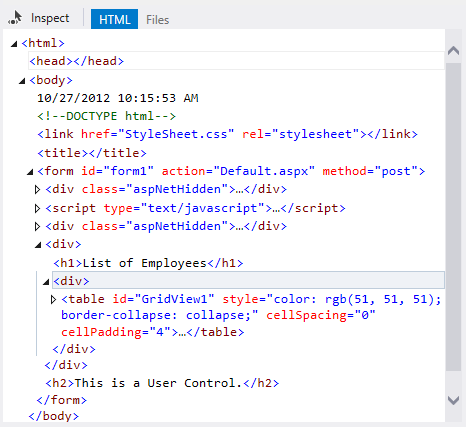
HTML Source
Below the page inspector browser window you can see and navigate through the HTML source of the web form. You will find that when you navigate to some HTML element the corresponding element is highlighted in the page inspector browser too making it easy for you to relate the HTML markup visually with the page. You can expand or collapse the HTML DOM tree and observe specific nodes and elements.
Viewing Files
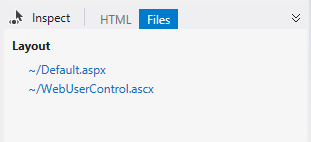
Viewing Files
Clicking on the Files tab of the page inspector window shows a list of files that make this web form. For example, in the above figure you see two entries namely Default.aspx and WebUserControl.ascx. When you click on any of the files, that file is opened in the respective Visual Studio editor.
Viewing Styling Information

Style Information
The styling information about the web form is presented in the HTML mode. As shown in the above figure the styling information is grouped in four tabs, viz. Styles, Trace Styles, Layout, and Attributes. The Styles tab shows the CSS styles applied to an HTML element selected in the HTML source window. The Layout tab shows the overall layout outline of the selected element along with its width, padding, margin, and such details (see below).
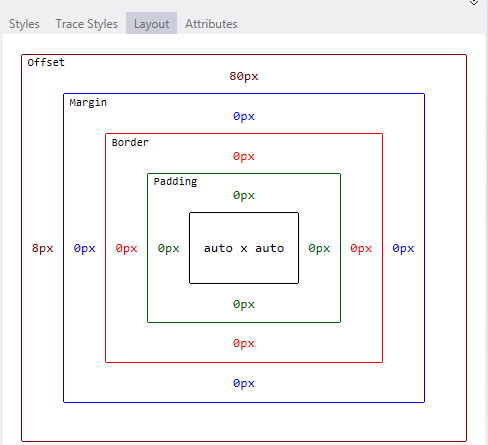
Layout Tab
Inspecting an HTML Element
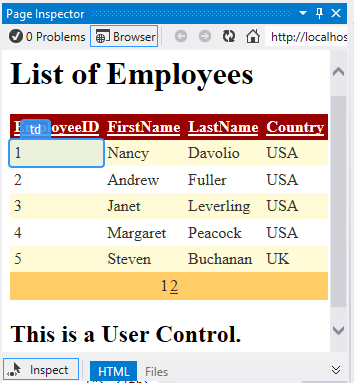
Page Inspector Browser
The HTML source window allows you to select a piece of HTML markup and see it visually in the page inspector browser. When you switch to Inspect mode your mouse pointer turns into a cross-hair. You can then position it on any part of the web form and see its HTML source in the HTML window. For example, if you select the first EmployeeID column selected in the page inspector browser its corresponding <td> element will be highlighted in the HTML window.
Summary
Visual Studio page inspector is a useful and handy tool that allows you to examine the HTML markup and style information of a web page. Using the page inspector you can inspect static HTML elements as well as elements generated dynamically through the server side code or server controls. The later use of the page inspector is very useful because it helps you to analyze, inspect and optimize the resultant HTML markup of the page.