

Introduction
Visual Studio 2013 (Update 2) offers many diagnostics tools that developers can use to debug their XAML-based Windows and Windows Phone 8.1 applications. Having access to a good debugging toolset ensures that developers can release applications that are reliable and perform well.
Debugging Support in Visual Studio 2013
Visual Studio 2013 support debugging swallowed exceptions and async code.
Debugging Swallowed Exceptions
Sometimes, we want to debug a situation where an exception gets swallowed (because of a catch block). For such situations, you can enable breaking into the debugger whenever the exception is throw. To set this up, go to the Debug menu and choose Exceptions.
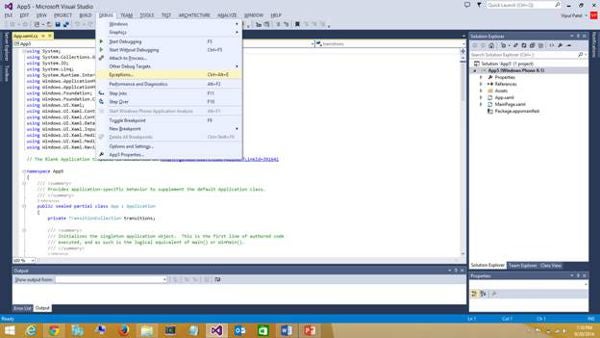
Figure 1: Choosing Exceptions
On the Exceptions dialog, select the checkbox for “Thrown” for CLR Exceptions, and click OK.
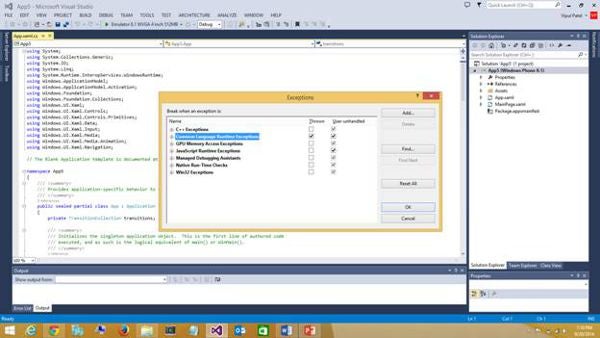
Figure 2: Selecting the checkbox for “Thrown” for CLR Exceptions
Now, in your debugging sessions, the debugger will break whenever a managed exception is thrown.
Debugging Async Code
Another new feature available in Visual Studio 2013 for Windows Phone 8.1 applications is the ability to debug async code. While debugging async methods in Windows Phone 8.1 XAML based applications, you can navigate to Debug – > Windows -> Tasks to find the status of async methods.
Figure 3: Finding the status of async methods
JSON Visualizer
Visual Studio 2013 now supports visualization of JSON text. With the move to more applications following the REST programming model, having a JSON visualizer can be very helpful.
Debugging Lifecycle Events
With Windows Phone 8.1 and Visual Studio 2013, we now can debug application lifecycle events. This feature was not supported in previous version of the mobile operating system. In your Debug Location toolbar, you can click the Lifecycle Events button to select the type of lifecycle event you want to debug.
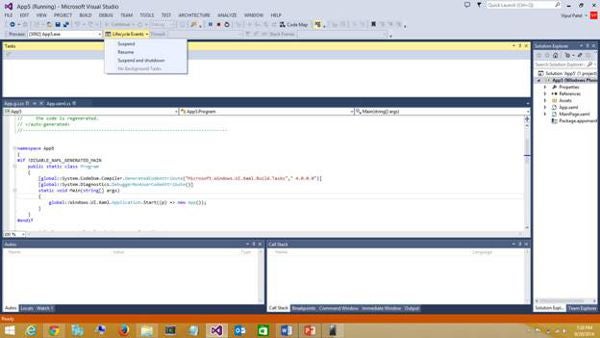
Figure 4: Selecting the type of lifecyle event you want to debug
Conditional Breakpoints
Visual Studio 2013 supports setting up conditional breakpoints for Windows Phone 8.1 applications.
Pinned Data Tips
Visual Studio 2013 now supports pinning data tips for quick reference in your debugging session. Select a variable, right-click, it and select “Pin to source”.
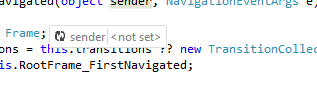
Figure 5: Selecting “Pin to source”
Performance
New in Visual Studio 2013 Update 2 is an entirely new way to check your application’s performance. Under the Debug menu, select Performance and Diagnostics.
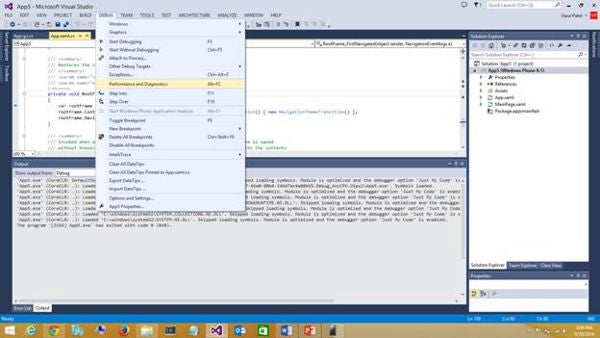
Figure 6: Selecting Performance and Diagnostics
This opens a Performance and Diagnostics session that offers several tools to diagnose the application’s performance.

Figure 7: The Performance and Diagnostics session
By default, there are a few tools available to debug CPU usage, Memory usage, Energy consumption, and XAML UI Responsiveness. Let us look at them one by one.
CPU Usage
To check the CPU usage of your application, check CPU Usage, and click start. The application is launched and a profiling session starts.
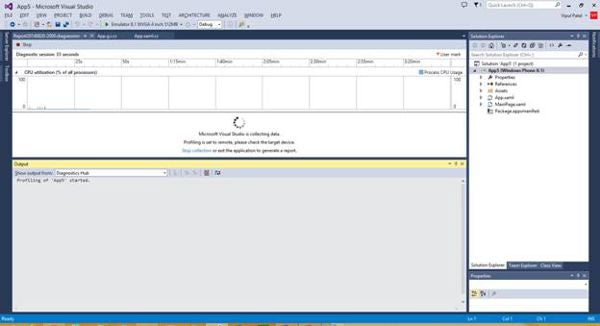
Figure 8: Launching the application
We now can interact with the application to generate profile data. Once we have gathered enough profile data, we can terminate the profiling session by exiting the application or selecting to “stop collection”. Once the profiling session is terminated, a report is generated. The report will look that shown in Figure 9.
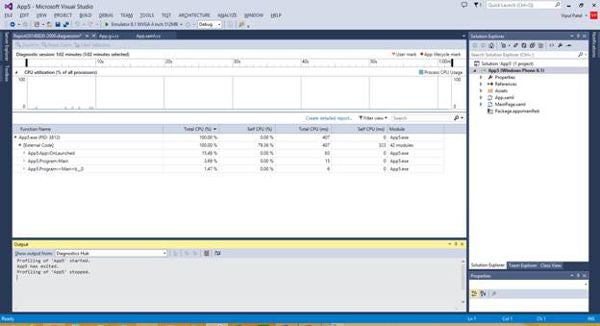
Figure 9: The generated report
We can see the functions in our application which are CPU hogs and determine the function that needs to be worked upon.
Memory Usage
To find issues such as memory leaks, we can use the “Memory Usage” option. We can specify if we want to monitor only managed memory, native memory, or both.
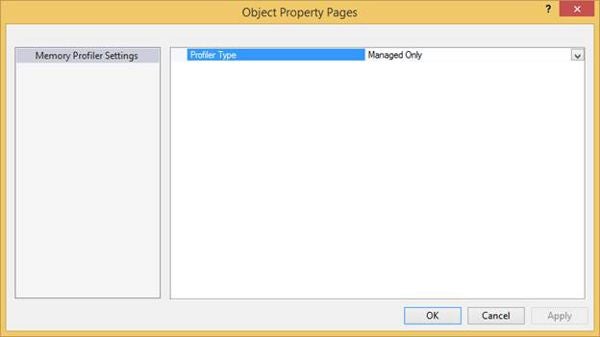
Figure 10: Specifying memory usage
When we start the memory profiler, we have an option to periodically capture memory snapshots to review later. Once your profiling session ends, the data is reported, as shown in Figure 11.
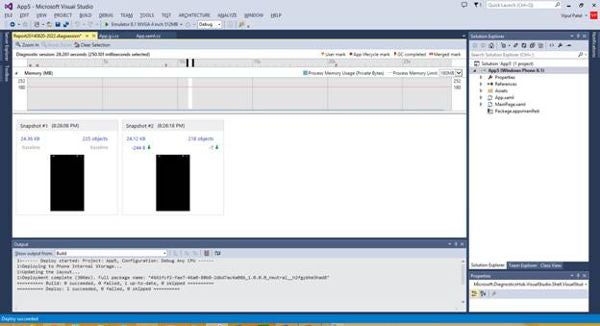
Figure 11: The data is being reported
We can see how the memory allocation has changed by looking at the memory footprint and number of objects. We can click the Objects link to see all the objects that were allocated on the managed heap.
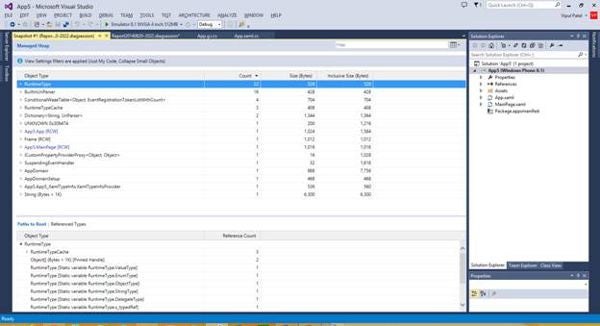
Figure 12: Viewing all the objects that were allocated on the managed heap
XAML UI Responsiveness
We also can use the profiler to measure the XAML UI responsiveness. Once we complete a profiling session for measuring XAML UI responsiveness, we will get a report that shows the UI thread utilization.
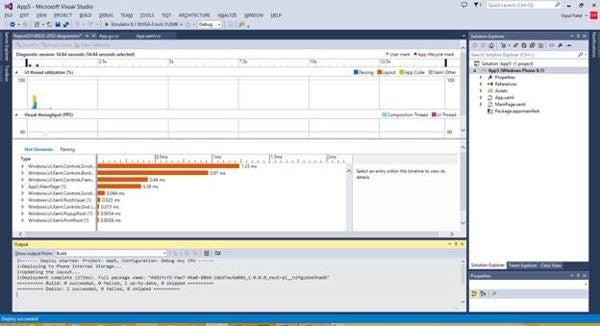
Figure 13: Viewing a report that shows the UI thread utilization
By using the above-mentioned tools, developers can effectively debug their XAML-based Windows and Windows Phone applications.
Summary
In this article, we learned about various tips and tricks to debug XAML-based Windows and Windows Phone applications.
About the Author
Vipul Patel is a technology geek based in Seattle. He can be reached at [email protected]. You can visit his LinkedIn profile at https://www.linkedin.com/pub/vipul-patel/6/675/508.